


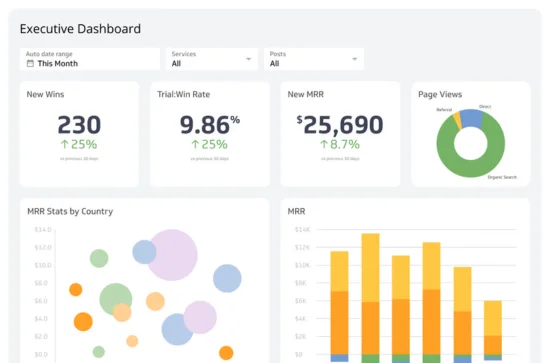
01. Executive Summary Dashboard
Track revenue, margins, liquidity, and ROI at a glance.
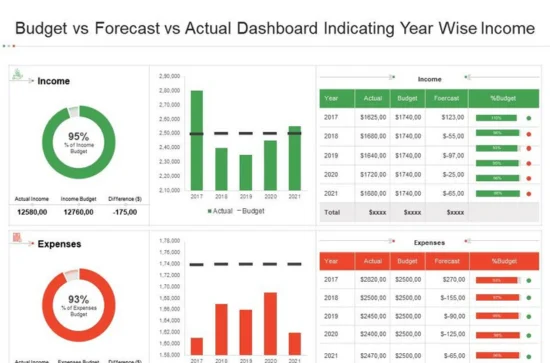
02. Budget vs Actuals & Forecasting
Spot variances instantly and plan scenarios with confidence.
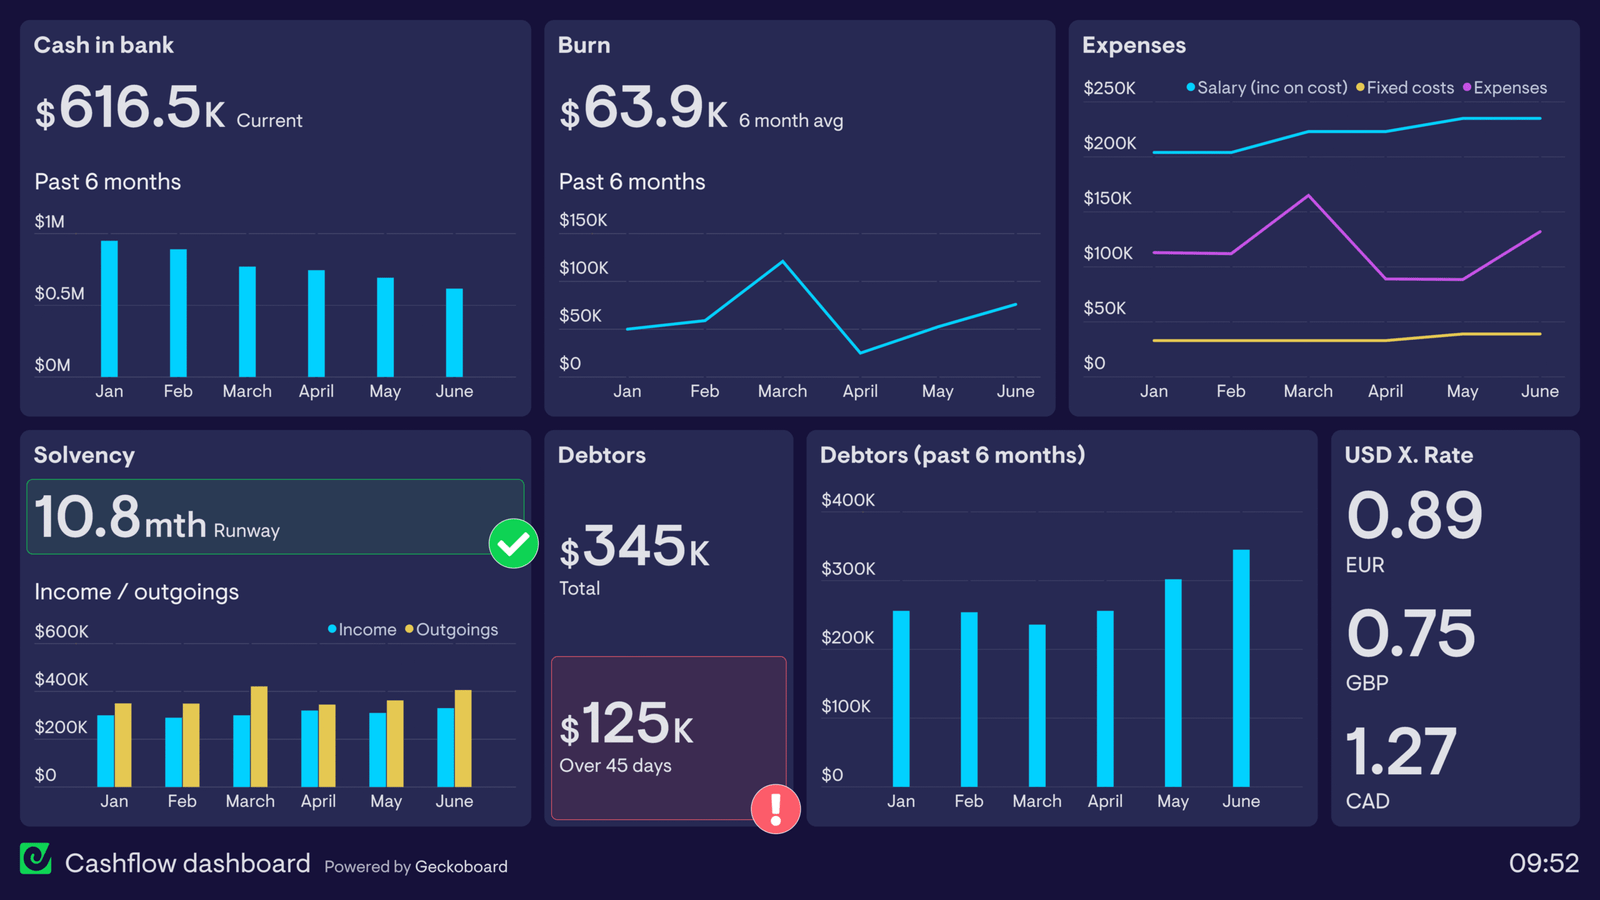
03. Cash Flow & Balance Sheet
Understand liquidity, debt/equity ratios, and cash runway.
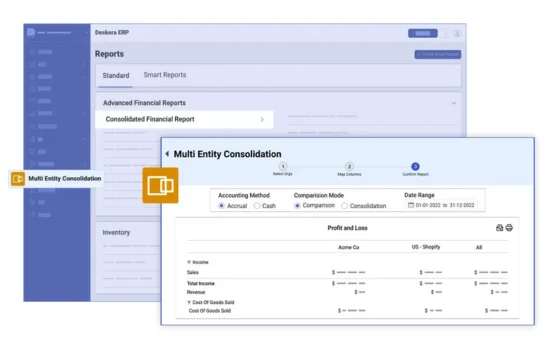
04. Multi-Entity Consolidation
Bring group-level reporting together without manual effort.

CFOs & Finance Leaders
investor-grade reporting, cash flow clarity, strategic KPIs

Controllers
automated variance analysis, compliance-focused reporting

Financial Analysts
DAX, Power Query, and advanced financial modeling
Accountants & Managers
– streamlined monthly close & reporting automation

Startups & Founders
– burn rate, runway, and profitability insights
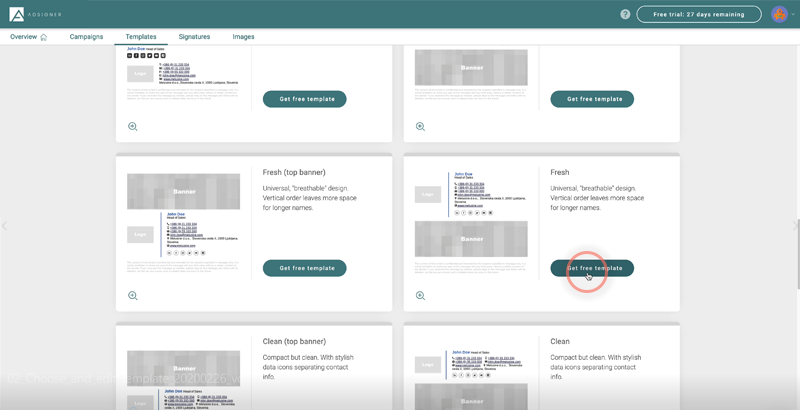
01. Choose a template
Our streamlined process ensures you get the exact financial dashboards you need, tailored to your specific data and KPIs.
02. Connect your data
ERP, QuickBooks, Xero, Excel, or SQL) via Power Query
03. Tailor KPIs & visuals
using DAX & financial modeling best practices
04. Automate reporting & share securely
across your organization


