Industry-Specific Power BI Finance Dashboards
Every industry has unique reporting needs. We design dashboards that fit your business model — from startups to enterprises.
Industries We Serve
Our expertise spans a diverse range of sectors, ensuring that your Power BI dashboards are not just data visualizations, but strategic tools perfectly aligned with your industry’s specific demands.
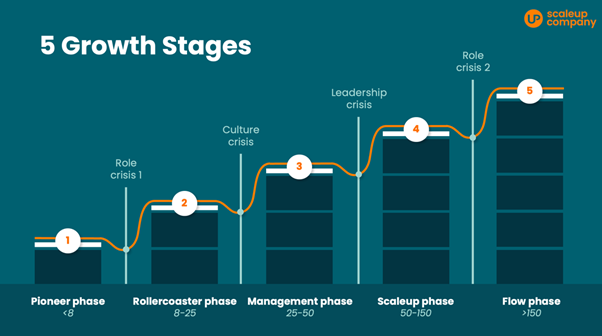
1. Startups & Scale-Ups
For founders and investors who need clarity on cash and growth.
- Burn rate & cash runway dashboards
- Investor-ready financial reporting (P&L, Balance Sheet, Cash Flow)
- Budget vs Actuals with rolling forecasts
Keywords: financial reporting for startups Power BI, Power BI for SaaS startups, FP&A dashboards for startups.


2. Retail & E-Commerce
Drive profitability across products, stores, and channels.
- Sales performance by category, region, and time
- Gross margin & net margin dashboards
- Inventory cost analysis & shrinkage monitoring
Keywords: Power BI for retail finance, revenue and profitability metrics dashboards.
3. Healthcare & Hospitals
Track efficiency, costs, and financial sustainability.
- Department-level budget vs actuals
- Cost per patient & service-line profitability
- Resource allocation & variance analysis
Keywords: healthcare financial analytics dashboard, operational efficiency analysis.


4. Manufacturing & Industrial
Visualize costs, revenues, and productivity.
- COGS (Cost of Goods Sold) dashboards
- Production efficiency & cost per unit tracking
- Forecasting for demand & capacity planning
Keywords: corporate finance analytics Power BI, variance analysis in manufacturing.
5. Professional Services & Consulting Firms
Optimize revenue and utilization.
- Billable vs non-billable hours
- Client/project profitability dashboards
- Revenue per consultant/engagement
Keywords: financial KPIs dashboard, profitability analysis dashboard.


6. Real Estate & Property Management
Simplify complex property-level reporting.
- Occupancy & rental income dashboards
- Debt-to-equity ratio and ROI tracking
- Consolidated reporting across portfolios
Keywords: Power BI for real estate finance, ROI dashboards.
Why Industry-Specific Dashboards?
Contextual KPIs: Each sector has different definitions of success
Tailored Data Models: Retail ≠ SaaS ≠ Healthcare
Scalable: From single-entity startups to global enterprises
Faster Insights: Spend less time building reports, more time making decisions

What Our
Clients Say
Don’t just take our word for it. Hear from finance leaders who have transformed their reporting with PowerBIGate.
4.8
Average Customer Rating
"PowerBIGate transformed our reporting process. What used to take 2 days in Excel now takes 2 minutes in Power BI — with dashboards our investors love."
SaaS StartupController
"Finally, dashboards built by finance people who understand finance. Not just pretty visuals, but real FP&A insights."
Mid-Sized Manufacturing FirmCFO
Your Industry. Your Data. Your Dashboards.
We customize Power BI finance dashboards for your business model, not a one-size-fits-all template.