In the fast-paced world of business intelligence (BI), data-driven decision-making is key to staying ahead of the competition. As organizations seek the best BI tool for their analytical needs, the question arises: How does Power BI stack up against other BI tools? This blog aims to provide an in-depth performance comparison, exploring the strengths and weaknesses of Power BI in comparison to its counterparts.
Why Performance Matters in BI Tools
Performance is a critical factor when evaluating BI tools. Faster data processing, real-time updates, and responsive dashboards ensure that users can access insights without delay. Let’s delve into the performance aspects that make Power BI stand out.
- Data Processing Speed
Power BI leverages a powerful data engine that enables high-speed data processing. Its in-memory caching and compression techniques optimize query performance, delivering lightning-fast results.
- Real-time Data Updates
For organizations requiring real-time insights, Power BI excels with its DirectQuery and Live Connection options. These features allow users to connect directly to data sources for up-to-the-minute analytics.
- Interactive Dashboards
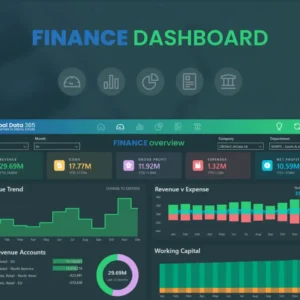
The interactive nature of Power BI dashboards fosters an immersive user experience. With responsive visuals and drill-down capabilities, users can gain deeper insights and explore data from multiple angles.
Comparing Power BI with Other BI Tools
Let’s dive into a head-to-head comparison of Power BI with other popular BI tools, including Tableau and QlikView.
- Power BI vs. Tableau
Power BI and Tableau are formidable contenders in the BI market. While both offer robust features, several key differences set them apart.
- Data Integration: Power BI seamlessly integrates with Microsoft applications, making it a top choice for organizations invested in the Microsoft ecosystem.
- Visualization Options: Tableau is renowned for its extensive range of visualization options and interactive features, offering a more diverse set of data representation choices.
- Learning Curve: Power BI’s user-friendly interface and familiarity with other Microsoft tools make it a favorable option for users already comfortable with the Microsoft suite.
- Power BI vs. QlikView
QlikView, like Power BI, is known for its powerful data discovery capabilities. Here’s how they compare.
- Data Association: QlikView’s unique associative data model allows users to explore data relationships dynamically. In contrast, Power BI follows a traditional data modeling approach.
- Scalability: Power BI’s integration with Azure allows it to handle vast datasets and deliver high-performance analytics for large enterprises.
- Cost-Effectiveness: Power BI’s competitive pricing and flexible licensing options make it a cost-effective choice for businesses of all sizes.
Conclusion
In the realm of BI tools, Power BI stands tall with its remarkable performance and user-friendly features. Its data processing speed, real-time updates, and interactive dashboards create a seamless user experience. While each BI tool has its strengths, Power BI’s integration with the Microsoft ecosystem, scalability, and cost-effectiveness make it a compelling choice for businesses seeking a robust data analytics solution.
As organizations navigate the complex landscape of BI tools, understanding their performance capabilities is crucial. Power BI’s continuous innovation and dedication to empowering data-driven decisions position it as a formidable player in the BI market.


