Table of Contents
TogglePower BI turns raw financial data into decisions. But the magic only happens when you track the right KPIs, model them correctly, and present them in visuals leaders can trust. This guide walks you through the 10 essential financial KPIs every Power BI dashboard should track, plus data modeling tips, DAX examples, and design patterns that keep CFOs and operators aligned.
Why “essential” matters: focusing on a small, battle-tested KPI set reduces noise, shortens time-to-insight, and increases adoption across finance, sales, and operations. The list below is carefully curated to balance profitability, efficiency, growth, and liquidity—so you can build a board-ready view without bloating your model.
What you’ll get: 10 KPIs with plain-English definitions, formulas, data sources, recommended visuals, DAX ideas, alerting thresholds, and common pitfalls—so you can go from blank canvas to executive-grade dashboard fast.
Talk to a Power BI finance specialist: info@powerbigate.com | +1 281 631 3767 | Book a Google Meet: https://calendly.com/bilalahmad3/30min
How to structure a finance-ready Power BI dashboard (and data model)
Star schema first. Keep your fact tables lean and conformed dimensions shared across them. Typical finance model:
-
Facts:
FactGL,FactRevenue,FactInvoicesAR,FactCash,FactExpenses,FactSubscriptions(for SaaS). -
Dimensions:
DimDate,DimAccount,DimCustomer,DimProduct,DimRegion,DimDept.
Calendar is king. Create a marked date table with contiguous dates, fiscal attributes, and standard hierarchies (Year → Quarter → Month → Day). This enables consistent period intelligence.
Common calculations (DAX snippets): -
Period selections:
Revenue :=

SUM ( FactRevenue[Amount] )CALCULATE ( [Revenue], DATEADD ( DimDate[Date], -1, YEAR ) )
DIVIDE ( [Revenue] – [Revenue LY], [Revenue LY] )
-
Rolling windows:
Revenue (TTM) :=

CALCULATE ( [Revenue], DATESINPERIOD ( DimDate[Date], MAX ( DimDate[Date] ), -12, MONTH ) )
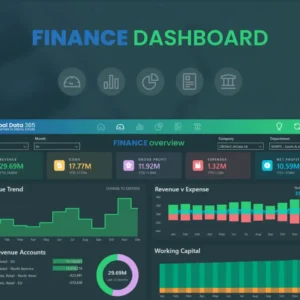
Visual layout blueprint: Top row = headline KPIs (cards/sparklines). Middle = trend visuals (area/line) + variance bars. Bottom = breakdowns (matrix by product/region) + diagnostic drillthrough pages.
Example KPI overview table
| KPI | What it reveals | Primary source | Recommended visual | Alert idea |
|---|---|---|---|---|
| Revenue Growth % | Topline momentum | FactRevenue | Line + YoY bar | Drop >2 pts MoM |
| Gross Margin % | Unit economics | FactRevenue, FactCOGS | Clustered bar by product | < Target band |
| Operating Margin % | Core profitability | FactGL/Expenses | Line with target | Negative turn |
| Net Profit Margin % | True earnings power | FactGL | KPI card + sparkline | < 5% for 2 months |
| Operating Cash Flow | Cash health from ops | FactCash/GL | Waterfall | Two negatives in a row |
| Cash Runway (Months) | Survival horizon | FactCash, burn rate | KPI card | < 6 months |
| CAC | Cost to acquire | FactMarketing, FactSales | Column vs channel | +20% QoQ |
| LTV & LTV:CAC | Payback quality | FactSubs, churn | Gauge + line | LTV:CAC < 3 |
| Churn (Logo/Revenue) | Retention risk | FactSubs/Revenue | Line + cohort | Spike >1 pt MoM |
| DSO | Collections speed | FactAR | Column by region | >45 days |
Need help modeling or implementing this in your environment? Email info@powerbigate.com or call +1 281 631 3767. Prefer a quick calendar slot? Book here: https://calendly.com/bilalahmad3/30min
The 10 essential financial KPIs (what, how, and where in Power BI)
1. Revenue Growth Rate
What it is: Percent change in revenue versus prior period. Tracks momentum and product-market fit.
Formula: (Revenue this period – Revenue prior period) / Revenue prior period.
DAX idea: Use [Revenue YoY %] and [Revenue MoM %] measures with standard DATEADD.
Visual: Line chart with YoY % bars; KPI card for current month with trend sparkline.
Pitfalls: Currency effects and one-off deals—tag and exclude for “Underlying Growth”.
2. Gross Margin %
What it is: Portion of revenue left after direct costs; reveals pricing power and unit economics.
Formula: (Revenue – COGS) / Revenue.
Data: FactRevenue[Amount], FactCOGS[Amount]; align revenue/COGS timing.
Visual: Clustered bar by product/family with a target band.
Pitfalls: Misallocated freight/discounts—model these as separate accounts and map correctly.
3. Operating Margin %
What it is: Profit from core operations before interest and taxes.
Formula: Operating Income / Revenue.
Data: FactGL with account mapping to OPEX vs COGS; ensure consistent chart of accounts.
Visual: Line with target; waterfall from Revenue → Gross Profit → OPEX → Op. Income.
Pitfalls: Capitalized software, restructuring—flag as non-recurring to avoid distorted trends.
4. Net Profit Margin %
What it is: Earnings after all expenses; ultimate profitability.
Formula: Net Income / Revenue.
Visual: KPI card + sparkline; matrix by region/product for mix diagnostics.
DAX tip: Use calculation groups for “% of Revenue” across multiple profit lines.
5. Operating Cash Flow
What it is: Cash generated by operations (not financing or investing).
Formula (direct): Cash receipts – cash payments (ops).
Data: Cash ledger or cash flow statements mapped to categories.
Visual: Waterfall by category (Receipts, Payroll, Suppliers, Taxes).
Alert: Two consecutive negative months or TTM turning negative.
6. Cash Runway (Months)
What it is: How long you can operate before cash hits zero at current burn rate.
Formula: Ending Cash Balance / Average Monthly Net Burn.
Data: FactCash for balances; calculate burn from OCF or Net Cash Outflow (ops).
Visual: KPI card with conditional color; trend of expected runway (forecast line).
Pitfalls: Ignoring committed but undrawn credit lines—track separately and disclose.
7. Customer Acquisition Cost (CAC)
What it is: Average cost to acquire one customer.
Formula: (Sales + Marketing Costs attributable to acquisition) / # New Customers.
Data: Marketing spend (GL), Sales comp, and CRM “New Logo” counts; normalize time periods.
Visual: Column by channel/campaign; line trend for blended CAC.
DAX tip: Create a bridge table mapping GL accounts and campaigns to “Acquisition” vs “Retention”.
8. Customer Lifetime Value (LTV) & LTV:CAC
What it is: Gross profit dollars you expect over a customer’s lifetime; ratio to CAC shows payback quality.
Typical formula (SaaS): ARPU * Gross Margin % / Churn Rate.
Data: Subscriptions (MRR/ARR), churn, gross margin; cohort tables improve accuracy.
Visual: Gauge for LTV:CAC with target ≥ 3; line trend for LTV and CAC separately.
Pitfalls: Using revenue instead of gross margin inflates LTV; mixing logo and revenue churn.
9. Churn Rate (Logo & Revenue)
What it is: Loss of customers (logo churn) or revenue (dollar churn) in a period.
Formula (logo): Lost Customers / Starting Customers; (revenue): MRR lost (ex-expansion) / Starting MRR.
Data: Subscription events (new, expansion, contraction, churn).
Visual: Line chart + cohort matrix by acquisition month.
Alert: Month-over-month increase >1 percentage point or cohort backslide after month 3.
10. Days Sales Outstanding (DSO)
What it is: Average days to collect receivables; cash efficiency and credit risk signal.
Formula: (Average AR / Revenue) * Days in Period (or use sales on credit).
Data: AR balances and credit sales by period.
Visual: Column by region/customer segment with trend line; scatter of DSO vs revenue to spot outliers.
Pitfalls: Mixing cash sales; not adjusting for write-offs or credit memos.
Pro design patterns and alerts (Power BI implementation quick wins)
a) KPI Cards + Sparklines: Use card visuals for the 10 KPIs with tiny 12-month sparklines. Keep variance vs target as a small bullet underneath (e.g., “−1.2 pts vs target”).
b) Variance visuals: For margins and growth, pair line trends with a bar showing variance to budget/LY.
c) Drillthrough: Right-click to a “Diagnostic” page with a waterfall and filters (Region, Product, Channel).
d) Goal tracking: Use Goals/Scorecards or treat targets as a FactTargets table and relate via Date + KPI key.
e) Alerts: In the Service, set alerts on KPI cards for thresholds (e.g., Runway < 6 months, LTV:CAC < 2.5, DSO > 45).
Sample DAX for targets and variance
Target Value :=

MAX ( FactTargets[TargetAmount] )[Actual Value] – [Target Value]
DIVIDE ( [Variance to Target], [Target Value] )
Governance, performance, and trust
Single version of truth: Centralize transformations in Power Query/Dataflows or Fabric Data Warehouse; avoid duplicated logic in report layers.
Row-level security (RLS): Secure by Region/Department/Customer owner so managers only see their slice.
Performance tips: Aggregations for large fact tables, disable auto date/time, optimize relationships on integers, and use composite models when necessary.
Data quality gates: Badge KPI cards when data freshness is >24h or source has reconciliation issues; link to a “Data Health” page.
Key Takeaways
-
Start with 10 KPIs that balance growth, profitability, and liquidity; add more only when questions demand it.
-
Build a clean star schema with a proper date table; your period intelligence depends on it.
-
Pair KPIs with diagnostic drillthroughs and target variance to move from “what” to “why”.
-
Add alerts for runway, margin, churn, DSO, and LTV:CAC to catch issues early.
-
Govern sources, apply RLS, and monitor data quality to maintain executive trust.
Summary
A high-impact finance dashboard in Power BI doesn’t try to show everything. It shows the right things—clearly, consistently, and with the ability to drill into drivers. Track Revenue Growth, Margins (Gross/Operating/Net), Operating Cash Flow, Cash Runway, CAC, LTV & LTV:CAC, Churn, and DSO. Implement them on a sturdy star schema, add target variance and alerts, and you’ve got a board-ready system that speeds decisions across the company.
Related Reading on PowerBIGate (internal links)
-
Essential Financial KPIs Every Power BI Dashboard Should Track
-
How to Create Your First Financial Dashboard in Power BI (Step-by-Step)
-
Home: https://powerbigate.com/
Final Call-to-Action
Have questions or want this built for your data in a week? Email info@powerbigate.com or call +1 281 631 3767. Prefer to meet? Book a Google Meet now: https://calendly.com/bilalahmad3/30min.


