Table of Contents
TogglePower BI can turn scattered spreadsheets into a single source of financial truth—without forcing your team to become BI engineers. If you’re just starting, this guide will help you go from “What is Power BI?” to a working, CFO-ready dashboard that answers the questions executives ask every week.
You’ll learn the essentials of data modeling for finance, the visuals that work, must-have KPIs, how to keep reports fast and trustworthy, and a 7-day build plan tailored for finance teams with limited bandwidth.
By the end, you’ll be ready to publish a secure, mobile-friendly, board-grade dashboard that your leadership will actually use.
Talk to a Power BI finance specialist: info@powerbigate.com | +1 281 631 3767 | Book a Google Meet: https://calendly.com/bilalahmad3/30min
Why Power BI for Finance
Finance teams juggle GL, AR/AP, budgets, payroll, CRM, and subscription data—usually in Excel. Power BI connects these sources, standardizes them, and gives you governed, refreshable dashboards with drill-downs. Benefits:
• Faster time-to-insight: your MTD/TTM/YoY views update with a refresh.
• Consistent answers: one model = one calculation for margin, churn, runway, DSO.
• Secure sharing: row-level security (RLS) shows each manager only their slice.
Core Concepts in 90 Seconds
• Dataset: your data model (tables, relationships, measures).
• Report: interactive pages built on the dataset.
• Dashboard: a pinned, at-a-glance canvas (cards, KPIs) for executives.
• Power BI Desktop: where you build; Power BI Service: where you publish, refresh, secure, and share. For a deeper primer on the ecosystem, read: Power BI Components—Desktop, Service, and Mobile Explained.
Talk to a Power BI finance specialist: info@powerbigate.com | +1 281 631 3767 | Book a Google Meet: https://calendly.com/bilalahmad3/30min
The Finance Starter Model (your star schema)
A clean star schema is the #1 success factor for finance dashboards.
Facts (transactions):
• FactGL (trial balance or journal lines)
• FactRevenue (orders/invoices or recognized revenue)
• FactAR (invoices + receipts)
• FactAP (bills + payments)
• FactCash (bank transactions)
• FactBudget (targets/forecast)
Dimensions (lookup tables):
• DimDate (fiscal calendar)
• DimAccount (CoA mapping to Revenue, COGS, OPEX)
• DimCustomer, DimVendor, DimProduct, DimDept, DimRegion
Rules: One Date table for everything (marked as Date). Integer surrogate keys for relationships. Keep facts skinny (amounts + keys), push logic to DAX measures.
Quick mapping table (example)
| Source System | Table | Loads Into | Notes |
|---|---|---|---|
| ERP/GL | Trial Balance | FactGL | Map to Segment (Rev, COGS, OPEX) |
| Billing/CRM | Invoices | FactRevenue | Recognize revenue by date rules |
| AR | Invoices/Receipts | FactAR | Needed for DSO & aging |
| AP | Bills/Payments | FactAP | OPEX control & cash planning |
| Bank | Statements | FactCash | OCF proxy & runway |
| FP&A | Budget/Targets | FactBudget | for variance reporting |
12 Must-Track KPIs for Beginners
Start small, get adoption, then expand. Here’s a balanced starter set:
-
Revenue Growth % (YoY, MoM)
-
Gross Margin %
-
Operating Margin %
-
Net Profit Margin %
-
Operating Cash Flow (monthly)
-
Cash Runway (months)
-
Days Sales Outstanding (DSO)
-
AR Aging (current, 30/60/90+)
-
OPEX vs Budget (and variance %)
-
CAC (if applicable)
-
LTV & LTV:CAC (if subscription/SaaS)
-
Churn (logo and revenue churn)
Want a deeper dive on KPI definitions and thresholds? See: 10 Essential Financial KPIs Every Power BI Dashboard Should Track and the companion overview: Essential Financial KPIs Every Power BI Dashboard Should Track.
KPI snapshot table
| KPI | Formula (plain) | Why it matters | Visual |
|---|---|---|---|
| Revenue Growth % | (Rev – Rev LY)/Rev LY | Topline momentum | Line + YoY bars |
| Gross Margin % | (Rev – COGS)/Rev | Unit economics | Clustered bar by product |
| Operating Margin % | Op Income/Rev | Core profitability | Line + target band |
| Net Profit Margin % | Net Income/Rev | Ultimate profitability | KPI card + sparkline |
| OCF | Receipts – Payments (ops) | Cash engine | Waterfall |
| Runway (months) | Cash / Net Burn | Survival horizon | KPI card (conditional) |
| DSO | (Avg AR/Rev)*Days | Collections efficiency | Column by region |
| AR Aging | Bucketed balances | Credit risk | Stacked bar + matrix |
| OPEX vs Budget % | (Actual – Budget)/Budget | Cost control | Variance columns |
| CAC | (Sales+Mktg)/New Logos | Growth efficiency | Column by channel |
| LTV | ARPU*GM%/Churn | Payback quality | Gauge + trend |
| Churn | Lost/Start (logo/$) | Retention | Line + cohort matrix |
Talk to a Power BI finance specialist: info@powerbigate.com | +1 281 631 3767 | Book a Google Meet: https://calendly.com/bilalahmad3/30min
Visuals That Finance Leaders Trust (mobile-first)
• KPI cards with tiny 12-month sparklines (Revenue, GM%, Op% Margin, Runway).
• Line + bar combo for Growth: line = revenue, bars = YoY%.
• Waterfall for Operating Cash Flow and P&L bridge (Revenue → GP → OPEX → Op Income).
• Matrix for P&L by Dept/Region with variance to Budget/LY.
• Column charts for DSO, AR Aging, CAC by channel.
• Cohort chart for churn/retention (acquisition month rows, month-since-start columns).
“Chart at a glance” mockups
• Growth Trend (line + YoY bars): stable → expanding margins; beware one-off spikes.
• AR Aging (stacked columns): watch 60/90+ segments—collections follow-ups needed.
• P&L Bridge (waterfall): pinpoints where margin is gained/lost month-to-month.
Build It in 7 Days (beginner plan)
Day 1: Scope & KPI list. Choose the 12 KPIs above. Confirm fiscal calendar and segments.
Day 2: Connect sources. ERP/GL, AR/AP, bank CSV, CRM/billing. Clean headers and data types in Power Query.
Day 3: Model. Build star schema: facts and dimensions; mark Date; create relationships.
Day 4: Measures. Write core DAX (Revenue, COGS, GP, margins, OPEX, OCF, DSO, Runway).
Day 5: Visuals. Lay out a single executive page + one drillthrough page.
Day 6: Refresh & RLS. Configure Gateway/Cloud refresh, define RLS roles (e.g., Region Managers).
Day 7: QA & publish. Tie-out totals to Excel/ERP. Publish to the Service. Set alerts (Runway < 6 months, DSO > 45, Churn ↑).
Basic DAX You’ll Actually Use
Revenue :=

SUM ( FactRevenue[Amount] )
Revenue LY :=

CALCULATE ( [Revenue], DATEADD ( DimDate[Date], -1, YEAR ) )
Revenue YoY % :=

DIVIDE ( [Revenue] - [Revenue LY], [Revenue LY] )
COGS :=

SUM ( FactGL[AmountCOGS] )
Gross Margin % :=

DIVIDE ( [Revenue] - [COGS], [Revenue] )
Operating Income :=

[Revenue] - [COGS] - SUM ( FactGL[OPEX] )
Operating Margin % :=

DIVIDE ( [Operating Income], [Revenue] )
DSO (Days) :=

VAR AvgAR = AVERAGEX ( VALUES ( DimDate[Month] ), SUM ( FactAR[AR_Balance] ) )

RETURN DIVIDE ( AvgAR, [Revenue] ) * 30
Net Burn (Monthly) :=

SUM ( FactCash[CashOutOps] ) - SUM ( FactCash[CashInOps] )
Runway (Months) :=

DIVIDE ( SUM ( FactCash[EndingCash] ), [Net Burn (Monthly)] )
Tip: create a FactTargets table for budget/targets and reuse a “Variance %” measure across visuals.
Data Refresh, Security, and Governance
• Refresh: Use scheduled refresh (e.g., 8:00, 14:00). For on-prem sources, configure an on-premises data gateway.
• Security: Row-Level Security by Region/Dept/Customer owner; test with “View as role” before publishing.
• Lineage: Keep transformations in Power Query/Dataflows (or Fabric Warehouse) and keep the report layer thin.
• Metadata: Document every measure (description field) so analysts understand definitions. For robust documentation and lineage at scale, see: Power BI Metadata Management.
• Excel parity: If finance still loves Excel, pin a link to an “Analyze in Excel” view and compare: Power BI vs Excel for Financial Reporting.
Performance Tips (so the model stays fast)
• Turn off Auto Date/Time; rely on a single DimDate.
• Prefer integers for keys; avoid relationships on text.
• Reduce column cardinality (split DateTime into Date + Time if needed).
• Use Aggregations for very large fact tables; summarize at Month level for most finance visuals.
• Replace calculated columns with measures where possible; calculated columns increase memory.
• Limit bi-directional relationships; use them only when necessary.
• Keep visuals simple; too many on one page slows render—use drillthrough for diagnostics.
Common Beginner Pitfalls (and fixes)
• Mixing currencies without a currency table → build a DimCurrency and convert at transaction or reporting date.
• Misaligned dates (invoice date vs recognition date) → create explicit “Revenue Recognition Date” and use it consistently.
• COGS misallocation (freight/discounts jammed into OPEX) → map properly in DimAccount.
• Budget variance chaos → define one Budget table and one “Variance %” measure; don’t duplicate logic across pages.
• Churn errors (logo vs revenue, mixing expansion) → track events (new, expansion, contraction, churn) in a subscription fact. For SaaS-specific patterns, visit: Power BI for SaaS Companies.
• Orphaned visuals after schema changes → use calculation groups and stable measure names.
Example “Starter” Dashboard Layout (mobile-friendly)
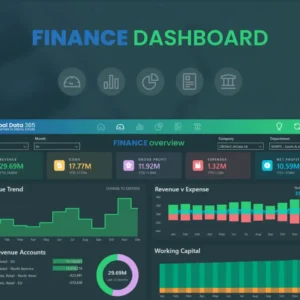
Top row (cards + sparklines): Revenue, Gross Margin %, Operating Margin %, Net Profit Margin %, Cash Runway (months).
Middle row: Growth Trend (line + YoY bars), P&L Bridge (waterfall).
Bottom row: AR Aging (stacked columns), DSO by Region (columns + goal), OPEX vs Budget (variance bars).
Drillthrough page: Filters (Date, Region, Dept, Product), a matrix by account and a detailed waterfall.
Mini “chart pack” table (what to use where)
| Question | Visual | Notes |
|---|---|---|
| “How’s topline trending?” | Line + YoY bars | Seasonal patterns jump out |
| “Where did profit move?” | Waterfall | Reconcile to P&L quickly |
| “Who’s slow to pay?” | Column + AR Aging | Trigger collections follow-ups |
| “Are we on budget?” | Variance bars/matrix | Show both value and % variance |
| “Is growth efficient?” | Gauge + line | LTV:CAC target ≥ 3 is common |
FAQs (Beginner Edition)
Q: Do we need a data warehouse first? Not to start. Power Query + Dataflows can get you live quickly; move to a warehouse as volume/complexity grows.
Q: How often should we refresh? Start twice daily; move to hourly if decisions require it and sources allow it.
Q: Can we keep some data private? Yes—RLS ensures leaders only see their slice (e.g., region or department).
Q: Excel vs Power BI? Use Excel for ad-hoc modeling; Power BI for governed, refreshable, drillable reporting. See: Power BI vs Excel for Financial Reporting.
Q: What should we build first? Executive overview page + one drillthrough diagnostics page. Add AR/AP and OPEX pages next.
Key Takeaways
• Model first: a clean star schema with one Date table beats any visual trick.
• Pick 12 KPIs and standardize definitions so finance, sales, and ops align.
• Use proven visuals (cards, line + bars, waterfall, matrix) and keep pages light.
• Lock down trust with refresh schedules, data quality checks, and RLS.
• Start simple (7-day plan), then iterate based on the questions leaders ask most.
Summary
Power BI gives finance teams a scalable way to deliver real-time visibility into growth, profitability, and cash. Start with a lean star schema, implement the essential KPIs, and present them in clear, mobile-friendly visuals. Secure the model, schedule refreshes, and measure what matters. With a disciplined build process, you’ll replace static monthly decks with a living, trusted financial cockpit that helps your leadership act faster—and with confidence.
Need help getting this live next week? Email info@powerbigate.com or call +1 281 631 3767. Prefer to meet? Book a Google Meet now: https://calendly.com/bilalahmad3/30min.
Related Reading (internal links)
• Essential Financial KPIs Every Power BI Dashboard Should Track
• Power BI for SaaS Companies
• Power BI Metadata Management
• Power BI vs Excel for Financial Reporting
• Power BI Components—Desktop, Service, and Mobile Explained
• Home: https://powerbigate.com/


