In today’s fast-paced, data-driven business environment, decision-makers require powerful tools that provide not only insights into historical data but also predictive capabilities. Among these tools, Microsoft Power BI stands out due to its robust forecasting features, allowing businesses to forecast future trends based on historical patterns. Power BI goes beyond traditional data analytics by enabling users to generate forecasts with minimal effort while offering an array of visualizations to communicate insights effectively.
This article delves deep into the world of Power BI forecasting, exploring its key features, applications, and the benefits it brings to organizations across various industries. We will also examine some challenges associated with forecasting, practical applications, and best practices for creating accurate predictions in Power BI.
Understanding Power BI Forecasting
What is Power BI?
Power BI is a business analytics service developed by Microsoft that allows users to connect to various data sources, transform raw data into insightful reports, and share those insights across an organization. The platform empowers users to create visually compelling reports and dashboards with a simple interface, enabling even non-technical users to access and analyze data efficiently.
One of Power BI’s standout features is its ability to perform forecasting. With its powerful built-in analytics, users can predict future outcomes by analyzing historical data. Whether it’s sales trends, financial performance, or customer behavior, Power BI’s forecasting tools offer valuable insights that can drive strategic decision-making across multiple business functions.

The Importance of Forecasting in Business
Forecasting is critical in virtually every industry. The ability to predict future trends and performance allows organizations to make informed decisions, allocate resources more effectively, and identify potential risks before they become significant issues. Accurate forecasting leads to better decision-making in areas such as:
- Strategic Planning: Companies can align their long-term goals with market conditions, customer demands, and future trends.
- Financial Management: Predicting revenue and expenses enables more precise budgeting, cash flow management, and profitability analysis.
- Supply Chain Optimization: Forecasting demand helps companies maintain optimal inventory levels, avoiding understocking or overstocking scenarios.
- Marketing and Sales Strategy: Businesses can tailor their marketing efforts based on predicted customer behavior, improving ROI from campaigns.
In an age where data is seen as the new oil, having tools that transform data into predictive insights is essential. Power BI provides businesses with this competitive advantage by merging its powerful analytics engine with user-friendly forecasting features.
Key Features of Power BI Forecasting
Forecasting in Power BI is primarily based on time-series analysis, where historical data is analyzed to predict future values. The platform is equipped with a range of features designed to enhance the forecasting experience and improve accuracy. Let’s explore some of the critical components of Power BI’s forecasting capabilities.
1. Time-Series Analysis
At the heart of Power BI forecasting is time-series analysis. This method involves analyzing data points collected or recorded at successive points in time. Time-series data is particularly useful for forecasting since it allows Power BI to detect trends, seasonal patterns, and cyclic behavior.
Example of Time-Series Forecasting
Consider a retail business tracking its monthly sales data over the last five years. Using time-series forecasting, Power BI can analyze historical sales to predict future monthly sales, helping the business plan its inventory, workforce, and marketing campaigns accordingly.
Why Time-Series is Effective
Time-series data provides the foundational structure for trend detection because it accounts for:
- Trends: Long-term directional movements in data.
- Seasonality: Recurring fluctuations that happen at regular intervals (e.g., increased retail sales during holidays).
- Cyclic Patterns: Repeated cycles occurring over longer periods, often influenced by economic or market conditions.
By utilizing these patterns, Power BI’s time-series forecasting provides organizations with a reliable way to predict future values based on their historical performance.
2. Seasonality Adjustments
One of Power BI’s most powerful features is its ability to handle seasonality. This function allows businesses to incorporate predictable fluctuations—such as monthly, quarterly, or yearly cycles—into their forecasts. By understanding the cyclical nature of specific industries, Power BI helps organizations create more accurate forecasts.
Example of Seasonality in Forecasting
A clothing retailer may experience higher sales during the holiday season and a dip in sales during the summer months. Power BI allows users to adjust for these patterns when forecasting, ensuring that the predicted sales figures for each month are aligned with historical seasonal trends.
Use of Seasonality for More Accurate Predictions
When businesses are able to account for seasonality in their forecasts, they can:
- Optimize inventory by preparing for peak seasons and managing slower periods more effectively.
- Enhance marketing efforts by concentrating promotions and campaigns during periods of high customer activity.
- Improve staffing and resource allocation by predicting periods of increased demand.
3. Automatic Data Refresh
Another significant feature of Power BI is the ability to set up automatic data refresh schedules. This means that Power BI can regularly update data from connected sources, ensuring that the latest information is always available for analysis and forecasting.
Benefits of Automatic Data Refresh
For organizations that need up-to-the-minute forecasts to make quick decisions, having real-time data is essential. By keeping the data continuously updated, Power BI provides decision-makers with:
- Timely insights: Ensuring that forecasts are based on the most recent data.
- Improved responsiveness: Organizations can react swiftly to new trends and changes in data patterns.
- Seamless forecasting: Teams can stay aligned on the latest data without manual intervention.
4. Confidence Intervals and Custom Parameters
In forecasting, it’s essential to understand the uncertainty associated with predictions. Power BI allows users to define confidence intervals, which show the range within which the actual value is expected to fall. Additionally, users can configure parameters such as forecast length, granularity, and seasonality to fine-tune their forecasts.
Customization for Enhanced Control
With these customization options, Power BI offers users more control over their forecasts. This flexibility ensures that the predictions align closely with specific business contexts and needs, improving accuracy. Customizing the confidence intervals also helps stakeholders understand the level of uncertainty, enabling better risk management.

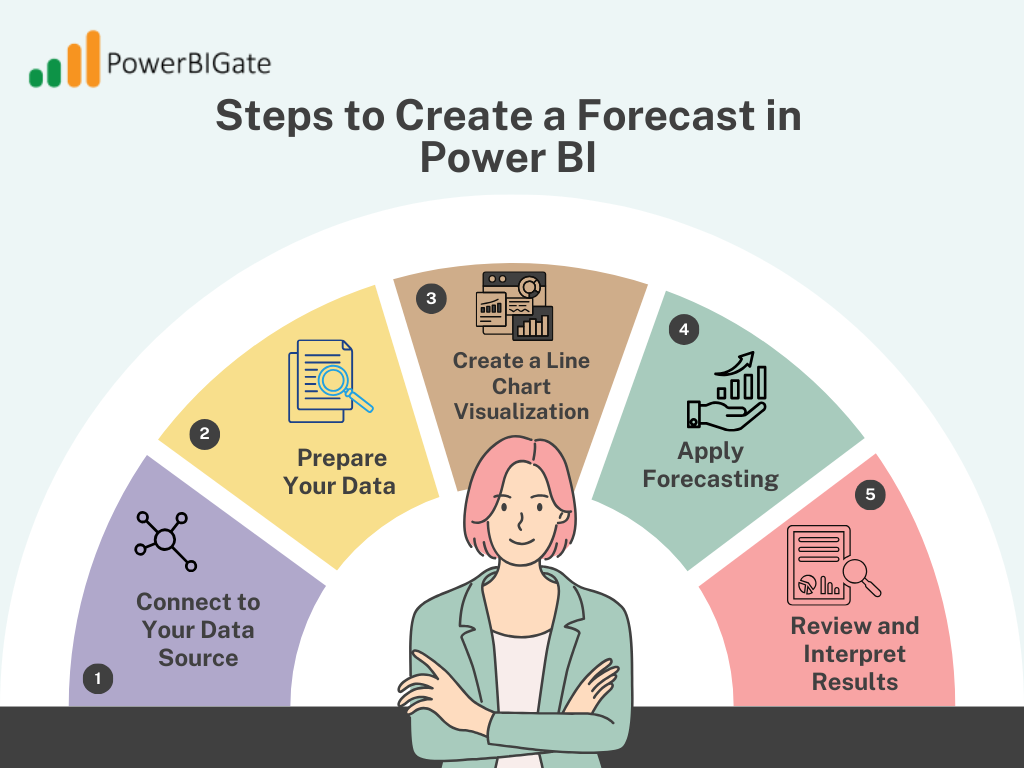
Steps to Create a Forecast in Power BI
Now that we understand the fundamental features of Power BI’s forecasting tools, let’s walk through the steps involved in creating a forecast.
1. Connect to Your Data Source
The first step is to connect Power BI to your desired data source. Power BI supports numerous data formats, including Excel files, SQL Server databases, cloud-based data sources (e.g., Azure), and APIs. Ensure that your dataset includes relevant historical data for the metric you wish to forecast.
Data Source Integration
The ease of data integration is one of Power BI’s strong suits. From simple CSV uploads to live connections with cloud-based databases, the platform seamlessly connects with most data sources, ensuring that businesses can access all the necessary data for accurate forecasting.
2. Prepare Your Data
Before generating a forecast, it’s essential to clean and prepare the data. Data preparation may involve removing outliers, filling in missing values, and transforming raw data into a format suitable for time-series analysis. Your dataset should include a date column to act as the time variable and one or more metrics you want to forecast.
Example: Data Preparation for Sales Forecasting
If you’re forecasting future sales, ensure that the dataset includes a date column (e.g., sales month) and a column containing sales figures (e.g., revenue). Additionally, it’s helpful to include any categorical variables like product types or regions if you wish to forecast specific segments.
3. Create a Line Chart Visualization
In Power BI, forecasts are created on line chart visualizations. Once your data is loaded and prepared, select the line chart from the visualization pane. Set your time variable (date) on the X-axis and the metric you want to forecast (e.g., sales or revenue) on the Y-axis.
4. Apply Forecasting
Once the line chart is created, go to the Analytics Pane. Under this pane, you’ll find the forecast option, which allows you to define your forecasting parameters. You can configure elements like forecast length, confidence intervals, and seasonality settings. These parameters determine how far into the future you want to forecast and how Power BI accounts for variability.
5. Review and Interpret Results
After applying the forecast, Power BI generates a projection for future data points. Review the results by comparing the forecasted values with your historical data to ensure accuracy. You can also drill down into specific time periods or metrics to gain deeper insights.
Use of Interactive Features
Power BI’s interactivity allows users to:
- Filter forecasts by region, product, or any other categorical variable.
- Drill down into specific timeframes for more detailed analysis.
- Visualize deviations from predictions to identify potential data anomalies.
Practical Applications of Power BI Forecasting
Power BI forecasting can be applied in numerous business scenarios across various industries. Below are some practical examples of how companies leverage these capabilities.
1. Marketing Campaigns
In marketing, predicting customer behavior is critical for optimizing campaign performance. Power BI forecasting allows marketers to analyze historical engagement data to predict how customers might respond to future campaigns.
Case Study: Forecasting Customer Engagement
A telecommunications company wants to predict customer responses to an upcoming promotion. By analyzing historical engagement metrics—such as click-through rates, conversion rates, and social media interactions—the company can forecast the expected engagement from the upcoming campaign. This allows the marketing team to optimize the budget allocation for maximum ROI.
2. Sales Projections
Sales forecasting is perhaps one of the most common applications of Power BI. By analyzing historical sales data, companies can predict future sales trends, allowing for better inventory planning and resource allocation.
Case Study: Sales Forecasting for Retail
A fashion retailer wants to predict sales during the holiday season. By analyzing five years of historical data, Power BI can generate forecasts that account for seasonal trends, customer purchasing behavior, and inventory turnover. The forecast helps the retailer stock up on the right products, avoiding both stockouts and excess inventory.
3. Financial Planning and Budgeting
Financial analysts can use Power BI’s forecasting capabilities to project future revenues, expenses, and profit margins. These projections help organizations prepare for upcoming financial cycles, make investment decisions, and plan for potential cost-cutting measures.
Case Study: Revenue Forecasting for a SaaS Company
A software-as-a-service (SaaS) company uses Power BI to analyze subscription data and predict future monthly recurring revenue (MRR). By incorporating variables such as customer churn, upgrades, and new customer acquisitions, Power BI generates forecasts that inform the company’s budgeting and hiring plans for the next fiscal year.
4. Supply Chain and Inventory Management
Forecasting in supply chain management is crucial for predicting demand and ensuring that companies have the right products available at the right time. Power BI allows businesses to forecast demand for specific products based on historical sales data and seasonal patterns.
Case Study: Inventory Optimization
A supermarket chain wants to optimize its inventory for perishable goods. Using Power BI, the chain can analyze sales data for perishable products like fruits and vegetables, incorporating seasonality into the forecast to predict demand fluctuations. This ensures the store minimizes waste while maintaining sufficient stock during peak demand.
Benefits of Using Power BI for Forecasting
Power BI provides several advantages when it comes to forecasting, making it a go-to tool for organizations looking to leverage data to predict future outcomes. Below are some of the most significant benefits:
1. Enhanced Decision-Making
The primary benefit of Power BI forecasting is its ability to enhance decision-making. By providing clear, data-driven predictions, Power BI helps stakeholders make informed decisions quickly. Whether it’s budgeting, marketing, or inventory management, decision-makers can rely on forecast data to align their strategies with anticipated trends.
Example of Improved Decision-Making
Consider a retail chain deciding whether to launch a new product in the upcoming quarter. Power BI can analyze historical product launches and market trends to provide forecasts on the expected performance of the new product. This insight allows executives to decide whether the launch should proceed or be postponed based on projected demand.
2. Improved Accuracy and Reliability
Power BI uses advanced algorithms to analyze large datasets, ensuring that forecasts are accurate and reliable. The platform’s ability to account for seasonality further enhances forecast accuracy, especially in industries where cyclical trends play a significant role.
Example of Accuracy in Forecasting
A travel agency that experiences seasonal demand fluctuations for vacation packages can use Power BI to generate precise forecasts based on historical bookings. By incorporating seasonality adjustments, Power BI offers a more accurate prediction of future bookings, allowing the agency to plan marketing efforts and staffing levels accordingly.
3. User-Friendly Interface
One of Power BI’s standout features is its user-friendly interface. The platform allows users with minimal technical expertise to create sophisticated forecasts with ease. This democratizes access to advanced forecasting tools across the organization, enabling more employees to contribute valuable insights to the decision-making process.
Example of User Empowerment
A mid-sized company with a small data analytics team uses Power BI to empower its sales, marketing, and finance departments to create their own forecasts. Without relying on data scientists, employees in these departments can now access and generate insights from their own data, increasing overall productivity and data-driven decision-making.
4. Seamless Collaboration
Power BI’s ability to share dashboards and reports across the organization enhances collaboration. Different teams can access and contribute to forecasts, ensuring that everyone is working from the same set of data.
Example of Cross-Departmental Collaboration
A multinational corporation uses Power BI to share sales forecasts with its finance, marketing, and supply chain teams. This shared access allows all departments to align their strategies based on the same predictions, ensuring that marketing campaigns, budgeting, and inventory planning are coordinated seamlessly.

Challenges and Considerations in Power BI Forecasting
While Power BI offers powerful forecasting capabilities, there are several challenges and considerations that users should be aware of:
1. Data Quality
The accuracy of any forecast relies heavily on the quality of the underlying data. Incomplete or inaccurate datasets can lead to misleading predictions, so it’s crucial to clean and validate data before using it for forecasting.
Example of Data Quality Issues
A company forecasting future sales may struggle with missing data from certain regions or product lines. If this incomplete data is not addressed, it can result in skewed forecasts that lead to poor decision-making.
2. Complexity of Models
While Power BI makes forecasting accessible, advanced models may require a deeper understanding of statistical and data science concepts. Users unfamiliar with these concepts may struggle to interpret complex forecasts correctly.
Example of Model Complexity
A financial analyst using Power BI to create a long-term revenue forecast may need to adjust parameters like confidence intervals and trend algorithms. Without a thorough understanding of these parameters, the analyst may generate forecasts that misrepresent the company’s future financial health.
3. Overfitting Risks
Overfitting occurs when a model is too closely tailored to historical data, which may not reflect future trends if external conditions change. This can lead to forecasts that are highly accurate for past data but unreliable for predicting future values.
Example of Overfitting
A retail company uses Power BI to forecast future sales but relies too heavily on data from the previous holiday season. If external factors, such as a downturn in consumer spending, occur, the forecast may be overly optimistic and fail to reflect the current economic reality.
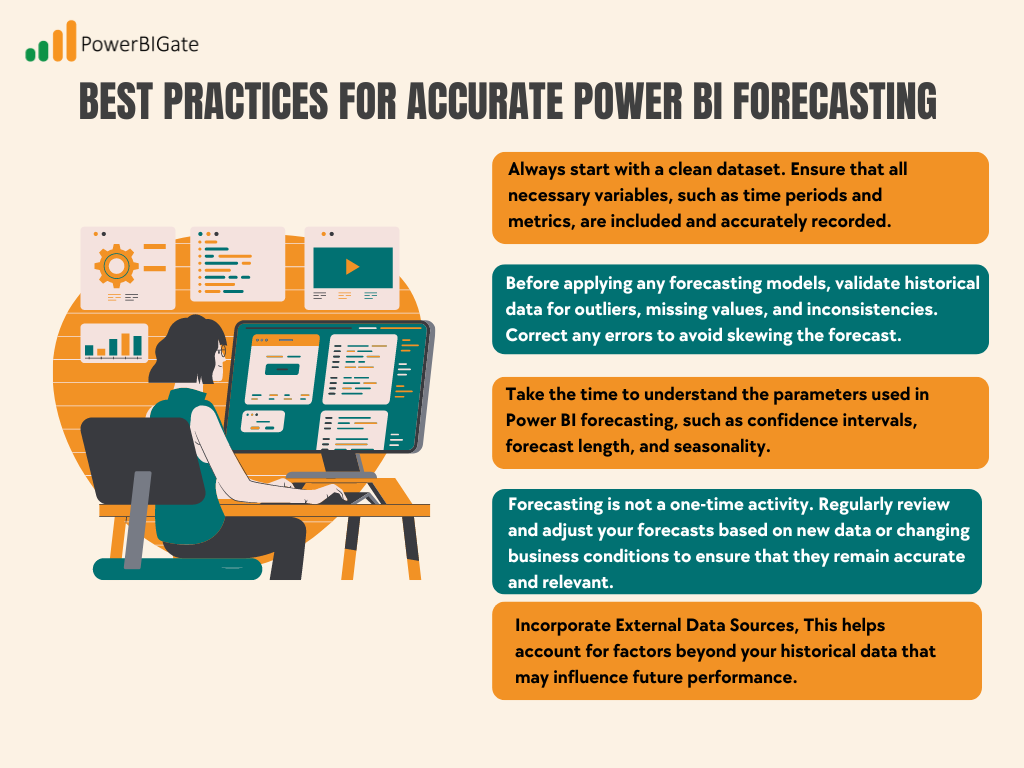
Best Practices for Accurate Power BI Forecasting
To maximize the accuracy and effectiveness of Power BI forecasts, consider the following best practices:
1. Use Clean and Complete Data
Always start with a clean dataset. Ensure that all necessary variables, such as time periods and metrics, are included and accurately recorded.
2. Validate Historical Data
Before applying any forecasting models, validate historical data for outliers, missing values, and inconsistencies. Correct any errors to avoid skewing the forecast.
3. Understand Your Forecast Parameters
Take the time to understand the parameters used in Power BI forecasting, such as confidence intervals, forecast length, and seasonality. Adjust these settings carefully to reflect the specific needs of your business.
4. Review Forecasts Regularly
Forecasting is not a one-time activity. Regularly review and adjust your forecasts based on new data or changing business conditions to ensure that they remain accurate and relevant.
5. Incorporate External Data Sources
Where possible, incorporate external data sources, such as economic indicators, market trends, or competitor data, to enhance your forecasts. This helps account for factors beyond your historical data that may influence future performance.
Conclusion
Power BI forecasting has revolutionized how organizations approach predictive analytics. By harnessing the power of historical data and advanced algorithms, businesses can gain valuable insights that drive strategic decision-making across functions such as marketing, sales, finance, and supply chain management.
While Power BI provides robust tools for forecasting, it’s essential to be aware of the challenges involved, such as data quality and model complexity. By following best practices and continuously refining your forecasts, you can ensure that your organization stays ahead of market trends and maintains a competitive edge.
As your business looks to embrace Power BI forecasting, consider how these insights could transform your operations and help you navigate the uncertainties of the future. What specific challenges does your organization face in predicting future trends? Share your thoughts and experiences in the comments below!