In the era of big data, organizations are increasingly seeking ways to harness vast amounts of information for better decision-making. Microsoft Power BI, a leading business intelligence tool, has emerged as a transformative solution that helps companies leverage data more effectively. A key feature of Power BI is its integration capabilities, enabling businesses to connect diverse data sources into a single platform for comprehensive analysis.
Power BI seamlessly integrates with various data sources, including databases, cloud services, and custom APIs, offering organizations the ability to consolidate and analyze fragmented data. This integration empowers businesses to gain actionable insights across multiple functions such as sales, finance, and marketing. Users can clean, transform, and visualize data in real-time, creating interactive dashboards that enhance decision-making.
The benefits of Power BI integration are substantial. It improves efficiency by automating data collection, enhances decision-making with accurate insights, and provides scalability as data needs grow. However, challenges such as data silos and system complexity may arise, which can be addressed through best practices like ensuring data quality, maintaining governance, and training users.
What is Power BI Integration?
Power BI integration involves connecting and consolidating data from multiple sources into Microsoft Power BI, enabling users to analyze, visualize, and derive actionable insights in a unified platform. These sources can include relational databases, cloud services, APIs, and on-premises applications, offering flexibility for organizations with diverse data systems.
The core advantage of Power BI integration is its ability to streamline data consolidation across various departments and functions, transforming fragmented data into a cohesive environment. This unified view allows businesses to perform deeper analyses, enabling better decision-making and fostering a data-driven culture throughout the organization.
With Power BI’s robust data transformation tools, users can clean, model, and prepare data for insightful visualizations and reports. The platform’s seamless connectivity allows organizations to integrate crucial data sources like SQL Server, Salesforce, Google Analytics, and more, without complex manual processes. Power BI also supports real-time data refresh, ensuring that stakeholders have access to the most current insights.
The integration capabilities of Power BI drive significant business benefits, such as improved decision-making through accurate insights, enhanced operational efficiency by automating data collection, and scalability to support growing data needs. By connecting different systems into one platform, Power BI promotes collaboration and enables organizations to make well-informed, data-backed strategic decisions.
In essence, Power BI integration is a powerful tool for businesses looking to unify their data landscape, enhance reporting capabilities, and empower teams to unlock valuable insights across all functions of the organization.
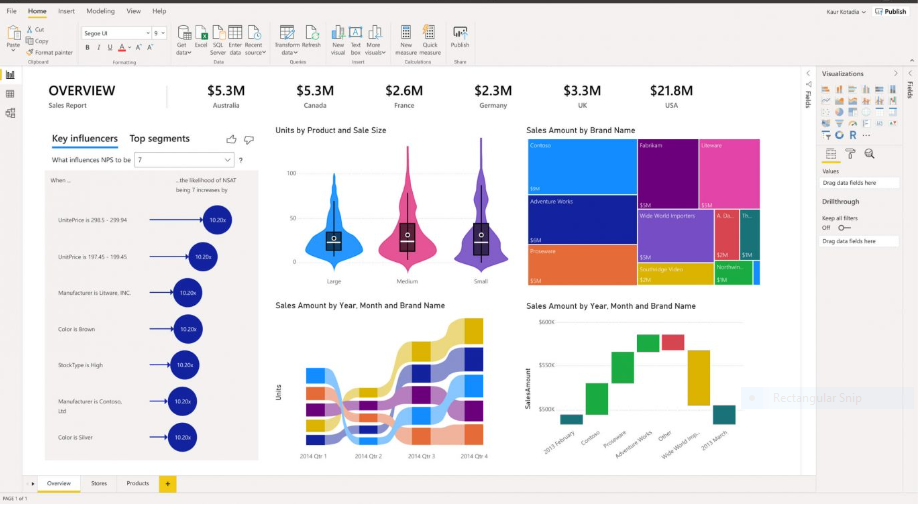
image source: https://dataintegrationinfo.com/power-bi-data-integration/
Why is Integration Important?
In today’s fast-paced business landscape, organizations often manage data scattered across numerous platforms and systems—such as CRM tools, ERP systems, marketing platforms, and finance software. Power BI integration is crucial because it consolidates these disparate data sources, providing a holistic view of business operations. The ability to visualize and analyze this unified data enables businesses to make better decisions, respond to changes more effectively, and improve strategic planning.
By integrating data from multiple sources into Power BI, organizations can access real-time insights, eliminating the inefficiencies associated with managing siloed data. This approach is essential for businesses that operate in dynamic environments where timely and informed decisions are critical to success.
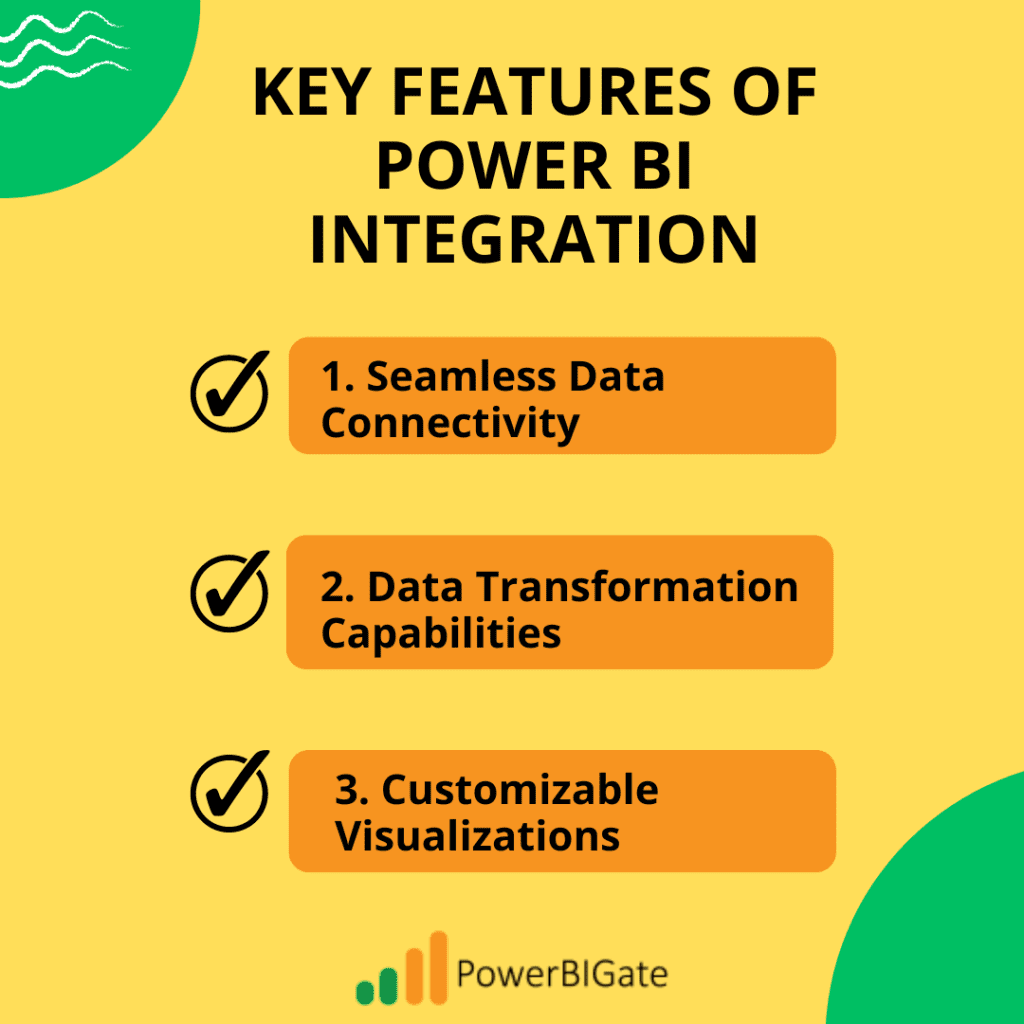
Key Features of Power BI Integration
Power BI offers a robust set of features that make it an ideal platform for data integration and analysis. Below, we explore some of the key features that make Power BI integration a powerful tool for organizations:
1. Seamless Data Connectivity
Power BI is renowned for its extensive data connectivity capabilities. It offers out-of-the-box connectors for a wide array of data sources, including:
- Relational Databases: Power BI allows seamless integration with popular relational databases such as SQL Server, MySQL, Oracle, and PostgreSQL. This enables businesses to bring in transactional and operational data for analysis.
- Cloud Services: Users can connect Power BI to leading cloud platforms such as Salesforce, Azure, Google Analytics, and Amazon Web Services (AWS). Cloud integration facilitates the analysis of customer data, marketing performance, and financial metrics.
- APIs: Organizations can leverage Power BI to pull data from custom APIs, making it possible to integrate specialized or proprietary systems that do not have native connectors.
With over 120 built-in connectors, Power BI provides unparalleled flexibility in connecting different systems. This extensive connectivity ensures that users can consolidate data from various sources into one accessible platform for holistic analysis and reporting.
2. Data Transformation Capabilities
Once data is integrated, Power BI offers robust tools for transforming raw data into meaningful insights. Using Power Query Editor, users can clean, reshape, and model their data before visualizing it in reports and dashboards. This transformation process is vital for ensuring accuracy and reliability in analytics. Data transformation includes:
- Data Cleaning: Removing duplicate entries, filling in missing values, and addressing inconsistencies.
- Data Shaping: Organizing and structuring the data into formats suitable for analysis, such as creating pivot tables, aggregating data, or calculating new metrics.
- Data Modeling: Establishing relationships between different data sets to facilitate more complex analyses, such as forecasting or what-if scenarios.
These transformation capabilities make Power BI an essential tool for preparing data for in-depth analysis, especially in large organizations where data complexity can hinder decision-making.
3. Customizable Visualizations
Power BI excels in creating highly customizable visualizations, allowing users to tailor their reports and dashboards to their specific business needs. With over 120 built-in connectors and the ability to create custom visuals using the Power BI Developer Tools, organizations can build visualizations that highlight key metrics, trends, and insights relevant to their operations.
- Interactive Dashboards: Power BI enables users to create dynamic and interactive dashboards that allow stakeholders to drill down into the data, filter by specific variables, and view detailed insights in real-time.
- Custom Visuals: Organizations can design custom visualizations that go beyond the standard charts and graphs, offering more unique ways to represent data. These visuals are particularly useful for representing complex metrics or creating industry-specific dashboards.
By tailoring visualizations to their unique needs, businesses can more effectively communicate insights to stakeholders, leading to better decision-making.
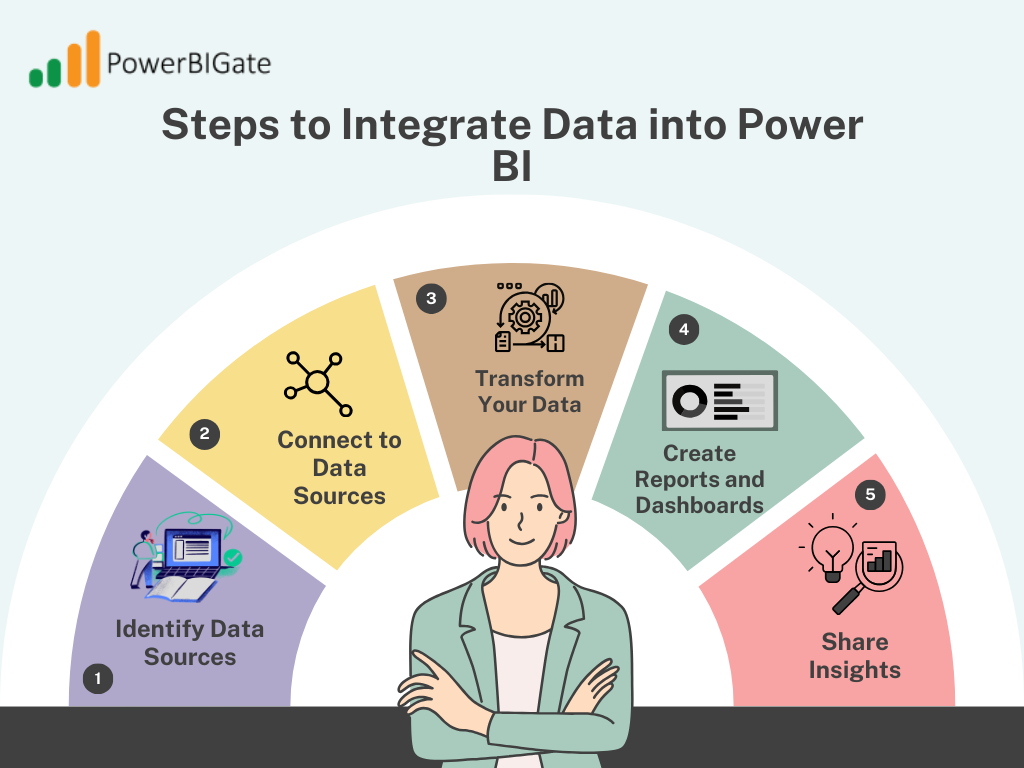
Steps to Integrate Data into Power BI
Power BI integration is a straightforward process that involves several key steps. Below is a breakdown of how to integrate data into Power BI:
Step 1: Identify Data Sources
The first step in Power BI integration is identifying the internal and external systems from which you need to pull data. These systems can include:
- Customer Relationship Management (CRM) platforms (e.g., Salesforce, HubSpot)
- Enterprise Resource Planning (ERP) systems (e.g., SAP, Microsoft Dynamics)
- Financial systems (e.g., QuickBooks, Oracle Financials)
- Marketing platforms (e.g., Google Analytics, Mailchimp)
Understanding your data sources is crucial for planning how you will consolidate and analyze data within Power BI.
Step 2: Connect to Data Sources
Once data sources have been identified, the next step is to connect them to Power BI. This can be done using Power BI’s “Get Data” feature, which allows you to select from a list of available connectors. For data sources that are not natively supported, you can use custom APIs or third-party integration tools.
Authentication is usually required to establish the connection, ensuring secure access to the data.
Step 3: Transform Your Data
After connecting to your data sources, it’s essential to clean and transform the data using Power Query Editor. This step involves addressing inconsistencies, such as missing values or incorrect formats, and ensuring the data is structured appropriately for analysis.
Data transformation ensures that the reports and dashboards built on top of the data are accurate and meaningful.
Step 4: Create Reports and Dashboards
Once the data has been cleaned and transformed, you can begin creating reports and dashboards using Power BI’s visualization tools. Power BI’s drag-and-drop interface makes it easy to build complex reports that visualize key business metrics.
- Choose from various visualization types, such as bar charts, line graphs, pie charts, and scatter plots.
- Apply filters, slicers, and drill-downs to make the reports more interactive and customizable.
Step 5: Share Insights
After creating your reports and dashboards, you can share them with other stakeholders by publishing them to the Power BI service. This allows team members to access and interact with the dashboards, facilitating collaboration and decision-making across departments.
Power BI also enables the scheduling of automatic refreshes, ensuring that the data remains up-to-date and relevant.
Practical Applications of Power BI Integration
Power BI integration has a wide range of practical applications across various industries. Below are a few key examples:
1. Sales Analytics
Sales teams can greatly benefit from Power BI integration by connecting CRM systems like Salesforce or Microsoft Dynamics 365. This integration allows sales teams to:
- Analyze sales performance data in real-time.
- Track customer interactions and identify high-value opportunities.
- Forecast future sales trends based on historical data.
By visualizing this data in Power BI, sales teams can identify bottlenecks in the sales funnel, improve customer engagement, and make data-driven decisions to drive revenue growth.
2. Financial Reporting
Finance departments can integrate accounting software such as QuickBooks or Oracle Financials into Power BI for real-time financial reporting. This enables finance teams to:
- Consolidate financial data from various sources (e.g., accounts receivable, cash flow, expense tracking).
- Generate detailed reports on cash flow, budgeting, and profit margins.
- Identify trends in financial performance and forecast future financial outcomes.
The ability to view all financial metrics in one place enhances transparency and enables finance professionals to make more informed decisions regarding budgeting and cost control.
3. Marketing Campaign Analysis
Marketers can integrate social media platforms, Google Analytics, and email marketing tools to analyze campaign performance. By consolidating marketing data from various channels, Power BI allows marketers to:
- Measure the effectiveness of marketing campaigns across multiple platforms (e.g., social media, email, paid search).
- Track customer engagement, website traffic, and conversion rates in real-time.
- Identify successful strategies and optimize future campaigns for better ROI.
With Power BI’s real-time data visualization capabilities, marketers can quickly adjust strategies based on performance metrics, ensuring better outcomes for future campaigns.

Benefits of Using Power BI Integration
Power BI integration offers numerous benefits to organizations looking to streamline their data analysis processes. Some of the most significant advantages include:
1. Enhanced Decision-Making
By providing a unified view of organizational operations through integrated data sources, Power BI empowers decision-makers with accurate, up-to-date insights. This unified view enables:
- Faster and more informed decision-making.
- A clearer understanding of key business trends and performance.
- Improved strategic planning based on reliable data.
Power BI’s ability to integrate diverse data sources allows businesses to see the bigger picture and make decisions that align with their long-term goals.
2. Increased Efficiency
Power BI automates many of the manual processes involved in compiling data from different systems. With seamless integration, users no longer need to export data from multiple platforms and consolidate it manually. This results in:
- Reduced time spent on data collection.
- More time available for analysis and strategic thinking.
- Streamlined reporting processes.
For organizations that deal with large volumes of data, the time saved through Power BI integration can translate into significant cost savings.
3. Scalability
As businesses grow, so do their data needs. Power BI integration is highly scalable, allowing organizations to:
- Easily add new data sources as their operations expand.
- Modify existing connections without significant disruptions.
- Scale data storage and processing capabilities in line with business growth.
This scalability ensures that Power BI remains a valuable tool for businesses of all sizes, from startups to large enterprises.
Best Practices for Successful Power BI Integration
To ensure successful integration, organizations should follow these best practices:
1. Ensure Data Quality
Before integrating data into Power BI, it is essential to verify the quality of the data. Implement checks for accuracy, completeness, and consistency across your data sources. Clean, reliable data is crucial for producing accurate insights.
2. Maintain Data Governance
Establish clear policies and procedures for managing data access, security, and compliance across integrated systems. Power BI’s security features, such as row-level security and data encryption, should be leveraged to protect sensitive information.
3. Regularly Update Connections
To ensure that reports and dashboards reflect the latest data, it’s essential to schedule regular updates of your data connections. Power BI allows for automated refreshes, ensuring that users have access to real-time insights.
4. Train Users
Provide comprehensive training for team members on how to use Power BI reports and dashboards effectively. A well-trained workforce is better equipped to make data-driven decisions and get the most out of Power BI integration.
Challenges in Power BI Integration
While Power BI integration offers numerous advantages, it also presents some challenges that organizations may need to address:
1. Data Silos
Many organizations struggle with accessing fragmented data stored in different silos across departments or systems. To overcome this challenge, it’s important to:
- Prioritize breaking down these silos through cross-departmental collaboration.
- Invest in technology solutions that facilitate data integration across systems.
2. Complexity of Systems
Integrating legacy systems or custom applications into Power BI can be complex and may require additional technical expertise. In such cases, businesses may need to:
- Engage IT professionals or consultants with experience in system integration.
- Consider using third-party integration tools that can simplify the process.
3. Performance Issues
Handling large datasets in Power BI can sometimes lead to performance issues, especially when working with complex queries or calculations. To mitigate these challenges, organizations should:
- Optimize queries by reducing the amount of data being processed.
- Use Power BI’s incremental refresh feature to load only the most recent data.

Conclusion
Power BI integration is a powerful tool that allows organizations to consolidate data from multiple sources into a single platform for enhanced analysis and reporting. By unifying data from diverse systems such as databases, cloud services, and APIs, Power BI enables users to gain a comprehensive view of their business operations, driving more informed decision-making.
One of the key advantages of Power BI integration is its seamless data connectivity. Whether integrating with on-premises databases like SQL Server or cloud-based platforms like Azure and Salesforce, Power BI allows users to connect effortlessly to various data sources. This eliminates the need for manual data consolidation, saving time and reducing the risk of errors.
Another standout feature is the ability to create customizable visualizations. Power BI offers a range of visual tools that can be tailored to specific business needs, helping teams visualize trends, track performance, and identify opportunities for improvement. These interactive dashboards and reports empower stakeholders to explore data in real time, leading to more agile and strategic decision-making.
Additionally, Power BI’s real-time data transformation capabilities allow businesses to clean, model, and refresh data automatically, ensuring that insights are always up-to-date. This ensures accuracy and enables organizations to react quickly to changing business conditions.
In summary, Power BI integration offers organizations a comprehensive solution for managing and analyzing their data. With seamless connectivity, customizable visualizations, and real-time data transformation, businesses can unlock valuable insights that support effective decision-making and drive growth across various functions.
Discussion Question: What challenges have you faced when integrating different data sources into your analytics workflow? Share your experiences in the comments below!