In the ever-evolving world of data analytics and business intelligence, where vast amounts of data are transformed into meaningful insights, Microsoft’s Power BI has emerged as a leading tool. From dashboards to reports, Power BI enables users to turn raw data into actionable intelligence, helping businesses make informed decisions. However, with the growing reliance on data-driven tools comes an increased amount of screen time, often leading to eye strain, fatigue, and reduced productivity. To address this, Microsoft introduced Power BI Dark Mode—a feature that does more than just enhance the interface’s aesthetics. It is designed to improve user experience, reduce eye strain, and boost productivity. Dark Mode, characterized by darker backgrounds and lighter text, has gained significant popularity across various platforms in recent years. It’s not just a trend or a visual preference; it serves a functional purpose, particularly for users who spend prolonged periods in front of screens. Dark Mode reduces the intensity of light emitted by device screens, which is especially useful in low-light environments or for users working late hours. This adjustment helps reduce eye strain and discomfort caused by the bright white backgrounds common in traditional design schemes. For Power BI users, the value of Dark Mode goes beyond aesthetics. Given that the platform is used for analyzing complex data and generating visual reports, users often spend extended periods of time on their screens. This can lead to eye fatigue, particularly when working on brightly lit dashboards for hours at a stretch. Power BI Dark Mode provides a soothing alternative that can help alleviate this strain.
Additionally, Power BI Dark Mode offers benefits in terms of focus and productivity. With a dark interface, the eye is naturally drawn to key data points, graphs, and charts, as they stand out more prominently against the darker background. This enhanced contrast makes it easier for users to focus on essential insights and reduces distractions, allowing for a more streamlined and efficient data analysis process.
Another key advantage of Power BI Dark Mode is its role in improving accessibility for users with certain visual impairments. The higher contrast ratio in Dark Mode can make text and visuals easier to read for those with light sensitivity or other visual conditions. In this way, Dark Mode is not just a cosmetic change, but a practical one that helps make Power BI more inclusive and user-friendly.
Microsoft has also ensured that Power BI Dark Mode is customizable to suit individual user preferences. Users can switch between light and dark themes, depending on the time of day, environment, or their visual comfort. This flexibility allows users to create an interface that best suits their working conditions, which can lead to enhanced user satisfaction and efficiency.
The Dawn of Darkness: Understanding Power BI Dark Mode
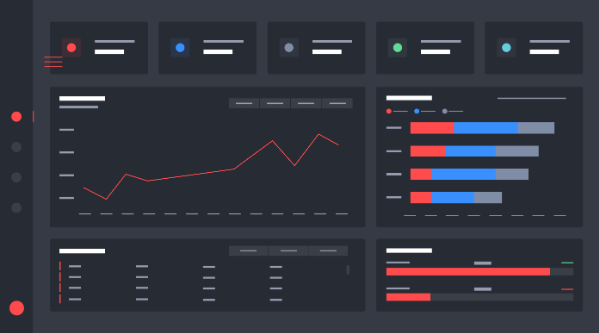
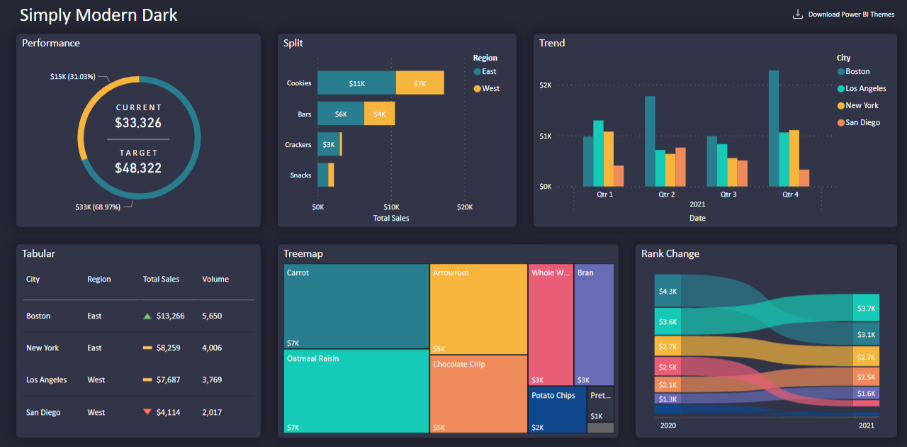
Power BI Dark Mode is more than just a color scheme flip. It’s a carefully designed visual overhaul that transforms the entire Power BI interface into a darker palette, primarily using deep grays and blacks. This feature caters to a growing demand for reduced eye strain during prolonged use, especially in low-light environments.
But why all the fuss about a darker interface? The benefits extend far beyond mere visual appeal:
- Reduced Eye Strain: Dark backgrounds with light text can significantly reduce eye fatigue, especially during extended work sessions.
- Enhanced Focus: The contrast in dark mode can make important data points stand out more prominently.
- Energy Efficiency: For OLED and AMOLED screens, dark mode can potentially save battery life.
- Improved Readability in Low Light: Perfect for burning the midnight oil or working in dimly lit environments.
- Aesthetic Appeal: Many users simply prefer the sleek, modern look of dark interfaces.
Embracing the Night: How to Enable Power BI Dark Mode
Activating Dark Mode in Power BI is a straightforward process, but it’s essential to know where to look. Here’s a step-by-step guide to help you embrace the dark side:
- Open Power BI Desktop
- Click on “File” in the top-left corner
- Select “Options and settings”
- Choose “Options”
- In the Options menu, select “Preview features”
- Check the box next to “Modern visual tooltips”
- Click “OK” and restart Power BI Desktop
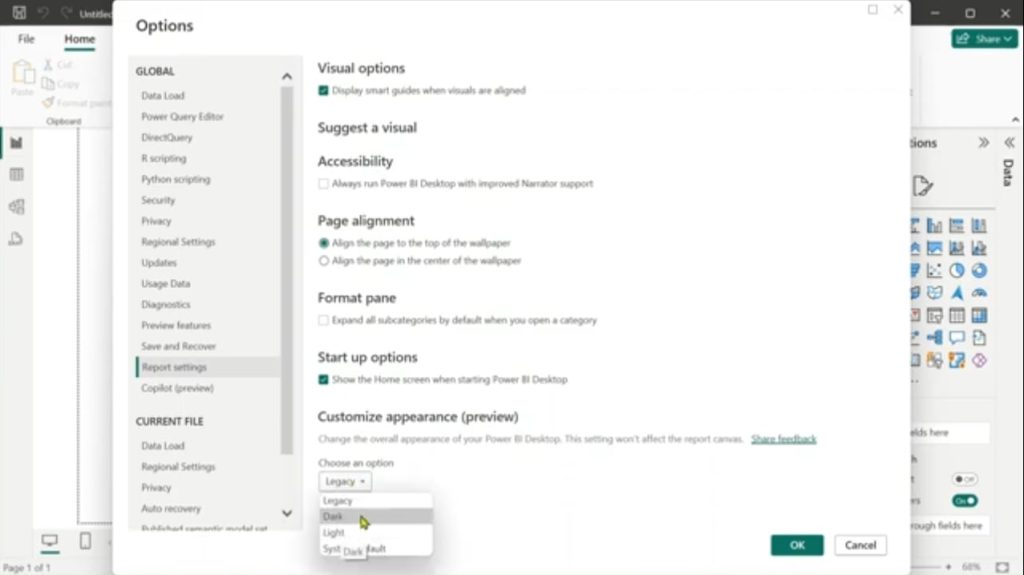
Once you’ve completed these steps, you’ll notice the interface has transformed into a sleek, dark theme. But the journey doesn’t end here – let’s explore how to make the most of this new visual landscape.
Navigating the Shadows: Tips for Optimizing Dark Mode Usage
While Dark Mode offers numerous benefits, it requires some adjustment to use effectively. Here are some tips to help you navigate this new visual terrain:
- Adjust Contrast and Brightness: Fine-tune your display settings to find the perfect balance for your eyes.
- Use Color Wisely: In Dark Mode, vibrant colors pop even more. Use this to your advantage in visualizations.
- Mind the Whites: Large white spaces can be jarring in Dark Mode. Consider using darker backgrounds for report pages.
- Test Different Visualizations: Some chart types may need adjustments to be easily readable in Dark Mode.
- Consider Your Audience: If sharing reports, remember that not all users may have Dark Mode enabled.
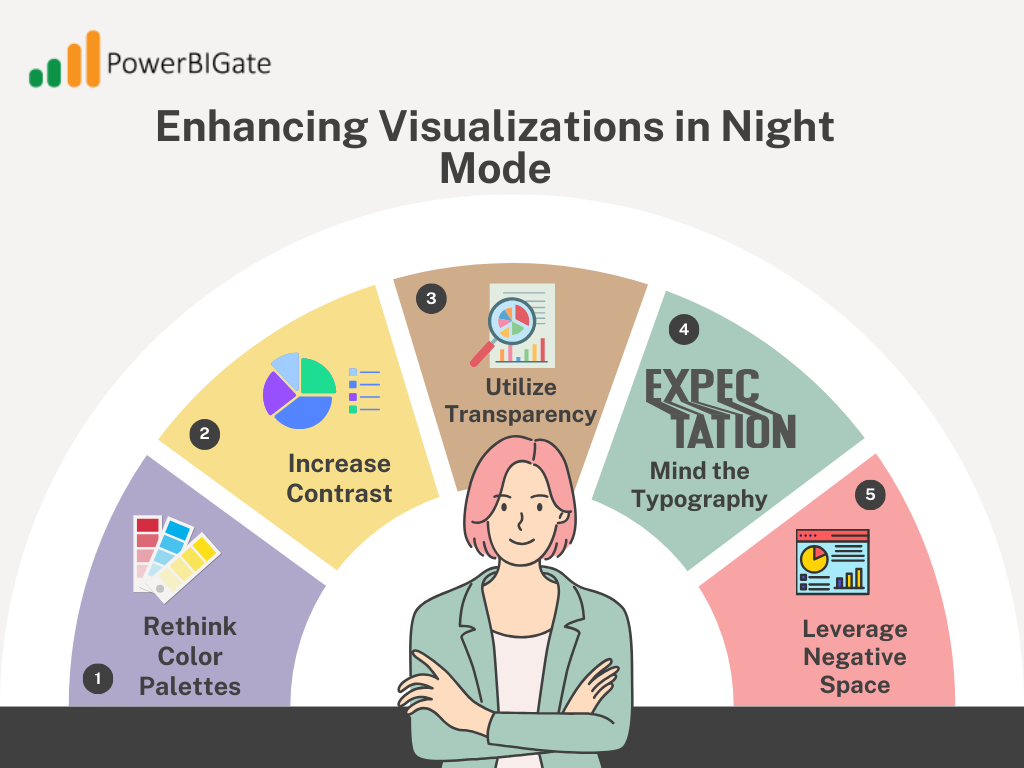
The Dark Side of Data: Enhancing Visualizations in Night Mode
One of the most significant impacts of Dark Mode is on data visualizations. The darker background can dramatically change how colors and contrasts are perceived. Here’s how to ensure your visualizations shine in the dark:
- Rethink Color Palettes: Colors that work well on light backgrounds may not translate effectively to dark themes. Experiment with different palettes to find what works best.
- Increase Contrast: Use lighter colors for important data points to make them stand out against the dark background.
- Utilize Transparency: Semi-transparent elements can add depth and sophistication to your visualizations in Dark Mode.
- Mind the Typography: Ensure your text is legible by using appropriate font sizes and colors.
- Leverage Negative Space: The dark background can create a sense of depth – use this to your advantage in your layout design.
Beyond the Visuals: Dark Mode and Cognitive Load
The benefits of Dark Mode extend beyond mere aesthetics and eye comfort. Research suggests that dark interfaces can potentially reduce cognitive load, allowing users to focus more on the data and less on the interface itself. This can lead to improved data interpretation and decision-making processes.
However, it’s important to note that the effectiveness of Dark Mode can vary depending on the individual and the specific use case. Some studies have shown that for tasks requiring prolonged reading of text, light mode may still be preferable. As with many aspects of data visualization, context is key.
The Power BI Ecosystem: Dark Mode Across Platforms
While we’ve primarily focused on Power BI Desktop, it’s worth noting that the Dark Mode experience extends across the Power BI ecosystem:
- Power BI Service (Web): The online version of Power BI also supports Dark Mode, providing a consistent experience for users who switch between desktop and web interfaces.
- Power BI Mobile: The mobile apps for iOS and Android offer Dark Mode options, perfect for on-the-go data analysis in various lighting conditions.
- Power BI Embedded: For developers integrating Power BI into their applications, Dark Mode considerations can be crucial for maintaining a cohesive user experience.
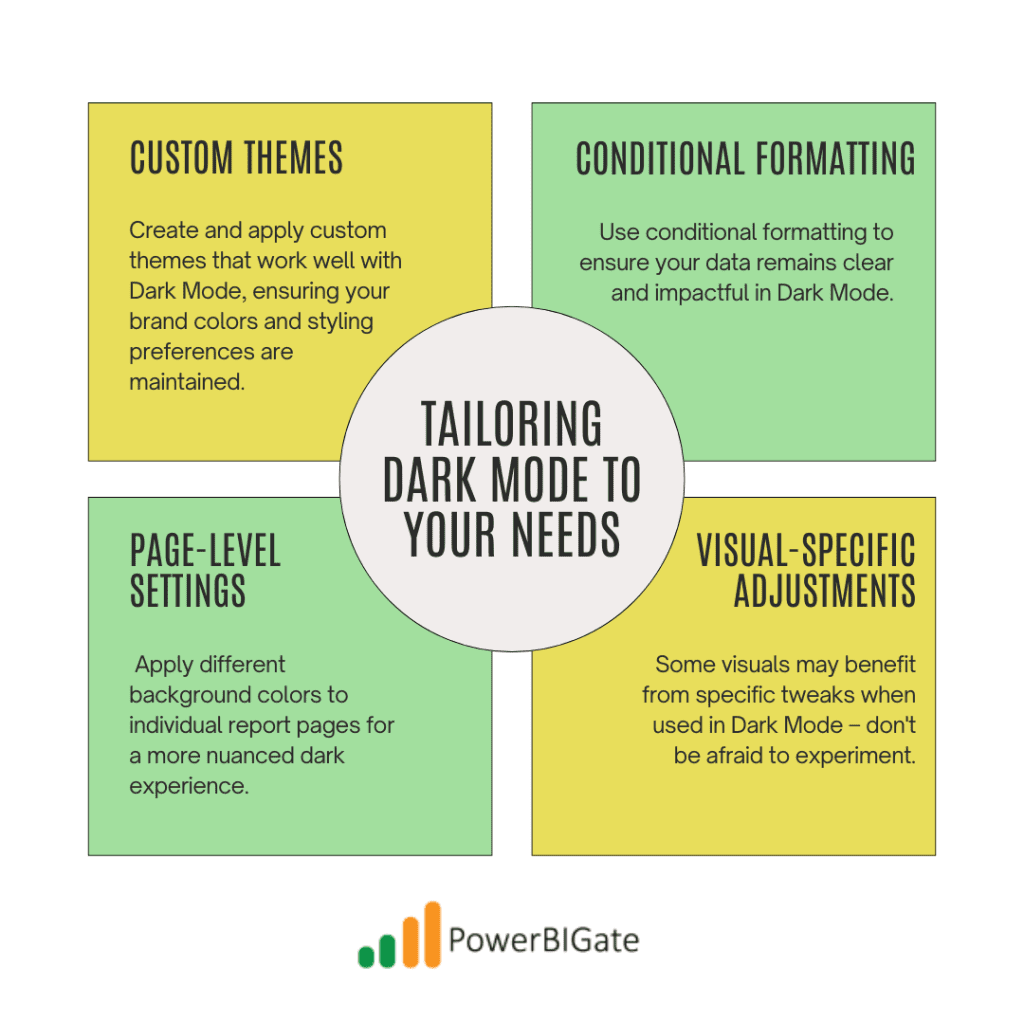
Customization is Key: Tailoring Dark Mode to Your Needs
One size doesn’t fit all, especially when it comes to visual preferences. Power BI recognizes this and offers various customization options to fine-tune your Dark Mode experience:
- Custom Themes: Create and apply custom themes that work well with Dark Mode, ensuring your brand colors and styling preferences are maintained.
- Conditional Formatting: Use conditional formatting to ensure your data remains clear and impactful in Dark Mode.
- Page-Level Settings: Apply different background colors to individual report pages for a more nuanced dark experience.
- Visual-Specific Adjustments: Some visuals may benefit from specific tweaks when used in Dark Mode – don’t be afraid to experiment.
The Future is Dark (Mode): What’s Next for Power BI?
As Power BI continues to evolve, we can expect further enhancements to the Dark Mode experience. Some potential developments to look out for include:
- AI-Driven Optimization: Imagine AI that automatically adjusts your visualizations for optimal viewing in Dark Mode.
- Enhanced Customization: More granular control over dark theme elements could be on the horizon.
- Contextual Switching: Automatic switching between light and dark modes based on time of day or ambient light conditions.
- Improved Accessibility: Further refinements to ensure Dark Mode enhances accessibility for all users.
Dark Mode Best Practices: A Checklist for Power BI Professionals
To wrap up our deep dive into Power BI Dark Mode, here’s a handy checklist to ensure you’re making the most of this feature:
- Regularly test your reports in both light and dark modes
- Use appropriate color contrast ratios for text and background elements
- Avoid pure black (#000000) for large areas – opt for dark grays instead
- Provide alternative color schemes for colorblind users
- Use shadows and depth carefully – they can be more pronounced in Dark Mode
- Regularly seek feedback from users on the readability and comfort of your dark mode designs
- Stay updated with the latest Power BI updates and dark mode enhancements
- Document your dark mode design decisions for consistency across projects

Illuminating the Dark: Case Studies in Effective Dark Mode Usage
To truly appreciate the impact of Dark Mode in Power BI, let’s look at some real-world applications:
Case Study 1: Financial Dashboard Overhaul A major bank transformed its executive dashboard using Power BI Dark Mode. The result? A 20% increase in dashboard usage during after-hours work, with executives reporting less eye strain during late-night analysis sessions.
Case Study 2: Healthcare Data Visualization A hospital system implemented Dark Mode for its patient data dashboards used in low-light environments. Nurses reported a 15% improvement in data readability during night shifts, potentially contributing to better patient care.
Case Study 3: E-commerce Analytics Revolution An online retailer switched its analytics platform to Power BI with Dark Mode. The marketing team noted a 30% increase in time spent analyzing data, attributing it to the more comfortable viewing experience, especially during intensive campaign periods.
These case studies highlight the tangible benefits of thoughtfully implemented Dark Mode in various industries and use cases.
Shedding Light on Dark Mode Myths
As with any popular feature, myths and misconceptions about Dark Mode abound. Let’s debunk some common ones:
Myth 1: Dark Mode Always Saves Battery Reality: While true for OLED screens, LCD screens may not see significant battery savings.
Myth 2: Dark Mode is Better for Everyone Reality: Individual preferences vary; some users may still prefer light modes for certain tasks.
Myth 3: Dark Mode Eliminates Blue Light Reality: Dark Mode can reduce overall screen brightness but doesn’t eliminate blue light entirely.
Myth 4: All Colors Work the Same in Dark Mode Reality: Color perception changes in dark environments, requiring thoughtful palette adjustments.
Understanding these nuances helps in creating more effective and user-friendly Dark Mode experiences in Power BI.
The Psychology of Dark Mode: Why It Works
The appeal of Dark Mode goes beyond mere functionality – there’s a psychological aspect to its effectiveness:
- Perceived Modernity: Dark interfaces are often associated with cutting-edge technology, potentially influencing user perception of the data presented.
- Emotional Impact: Darker themes can evoke feelings of sophistication and depth, potentially enhancing the perceived importance of the data.
- Focus Enhancement: The reduced visual noise of dark backgrounds can help users focus more intensely on the data at hand.
- Comfort in Familiarity: As more applications adopt dark modes, users become increasingly comfortable with this visual style.
Understanding these psychological factors can help in designing more impactful and user-friendly Power BI reports and dashboards.
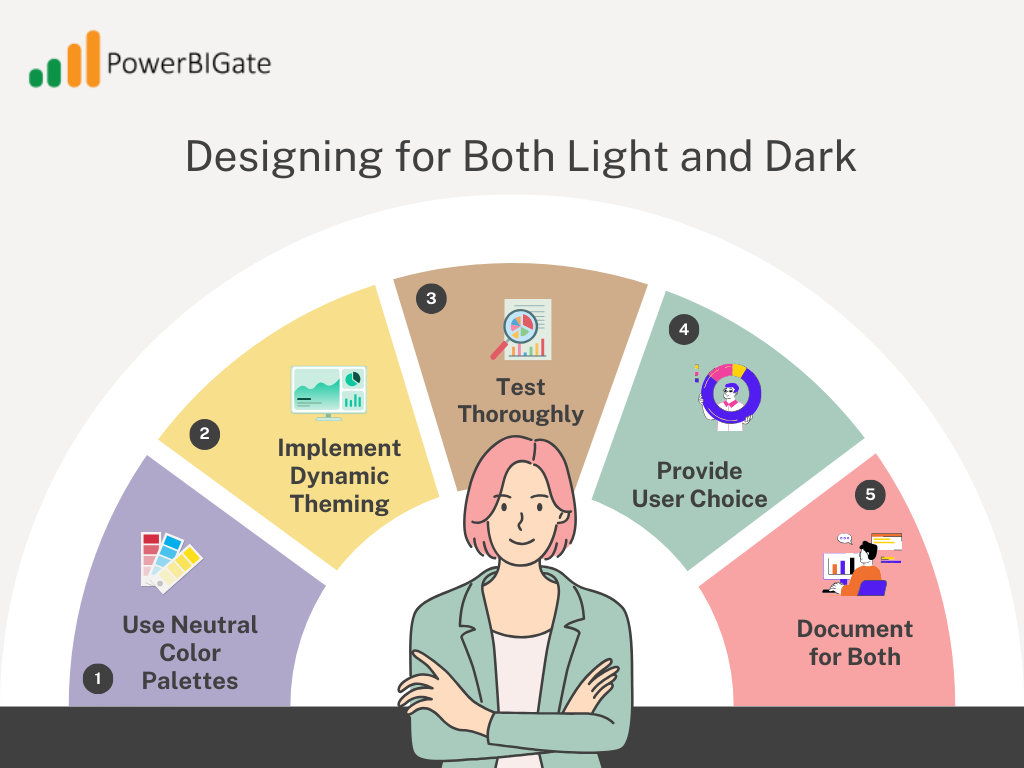
Bridging the Gap: Designing for Both Light and Dark
While Dark Mode offers numerous benefits, it’s crucial to remember that many users still prefer or require light modes. Here are some strategies for creating Power BI reports that shine in both environments:
- Use Neutral Color Palettes: Choose colors that translate well between light and dark backgrounds.
- Implement Dynamic Theming: Design reports that can automatically adjust based on the user’s mode preference.
- Test Thoroughly: Regularly view your reports in both modes to ensure clarity and readability.
- Provide User Choice: When possible, allow users to switch between modes within the report itself.
- Document for Both: Ensure any accompanying documentation or guides account for both light and dark mode users.
By considering both modes in your design process, you create more inclusive and versatile Power BI solutions.
The Global Impact: Dark Mode and International Users
As Power BI is used globally, it’s worth considering how Dark Mode impacts international users:
- Cultural Considerations: Color perceptions and preferences can vary across cultures, affecting Dark Mode reception.
- Language Support: Ensure that Dark Mode works well with various languages and character sets.
- Time Zone Adaptations: For global teams, Dark Mode can be particularly beneficial for those working across different time zones.
- Accessibility Standards: Different countries may have varying accessibility requirements that Dark Mode can help address.
Considering these global factors ensures that your Power BI Dark Mode implementation is truly world-class.
Conclusion: Embracing the Dark Side of Power BI
Power BI Dark Mode is more than just a visual gimmick – it’s a powerful tool for enhancing data visualization, improving user comfort, and potentially boosting productivity. By understanding its benefits, implementation techniques, and best practices, you can leverage Dark Mode to create more engaging, accessible, and effective Power BI reports and dashboards.
As we continue to push the boundaries of data analysis and visualization, features like Dark Mode play a crucial role in shaping how we interact with and interpret complex information. Whether you’re a night owl analyst, a considerate designer, or simply someone who appreciates the sleek aesthetics of a dark interface, Power BI Dark Mode offers something for everyone.
As Microsoft continues to develop Power BI, it’s clear that user experience remains a top priority. Power BI Dark Mode is just one of many features that aim to improve both the practicality and the appeal of the platform. As more users adopt Dark Mode, we can expect further refinements and optimizations to enhance the experience even further.
Power BI Dark Mode is not merely a visual upgrade—it’s a functional improvement that addresses the modern challenges of working with data. By reducing eye strain, improving focus, and enhancing overall usability, Dark Mode is set to become a staple feature for Power BI users, proving that even small design changes can make a big difference in productivity and user satisfaction.
Remember, the key to mastering Dark Mode lies in understanding its nuances, regularly testing and refining your designs, and always keeping your end-users in mind. As you embark on your Dark Mode journey, stay curious, experiment boldly, and don’t be afraid to push the envelope of what’s possible in data visualization.
Now, we turn to you, the Power BI community: What has been your experience with Dark Mode? Have you noticed any unexpected benefits or challenges in your data visualization work? Share your thoughts and experiences in the comments below – your insights could illuminate the path for fellow data enthusiasts venturing into the dark side of Power BI!