Power BI has revolutionized the way businesses analyze and visualize data, providing users with the ability to create dynamic, insightful, and interactive reports. Among its many powerful features, one stands out for data analysts and business intelligence professionals: VLOOKUP. While VLOOKUP is a well-known function in Excel, its equivalent in Power BI, implemented through DAX (Data Analysis Expressions) functions, is an essential tool for matching and combining data from various sources. In this comprehensive guide, we’ll explore the ins and outs of using VLOOKUP in Power BI, from basic concepts to advanced techniques that can significantly enhance your data analysis capabilities.
What is VLOOKUP in Power BI?
VLOOKUP, short for “Vertical Lookup,” is a function that allows you to search for specific values in a table and retrieve corresponding information from another column. In Excel, VLOOKUP is used to look up data in a table based on a search value, but in Power BI, this functionality is implemented using DAX functions. DAX offers greater flexibility, enabling data analysts to perform lookups across tables, handle complex relationships, and perform calculations.
Why VLOOKUP Matters in Power BI
Before diving into the technical details, it’s essential to understand why VLOOKUP-like functionality is crucial in Power BI:
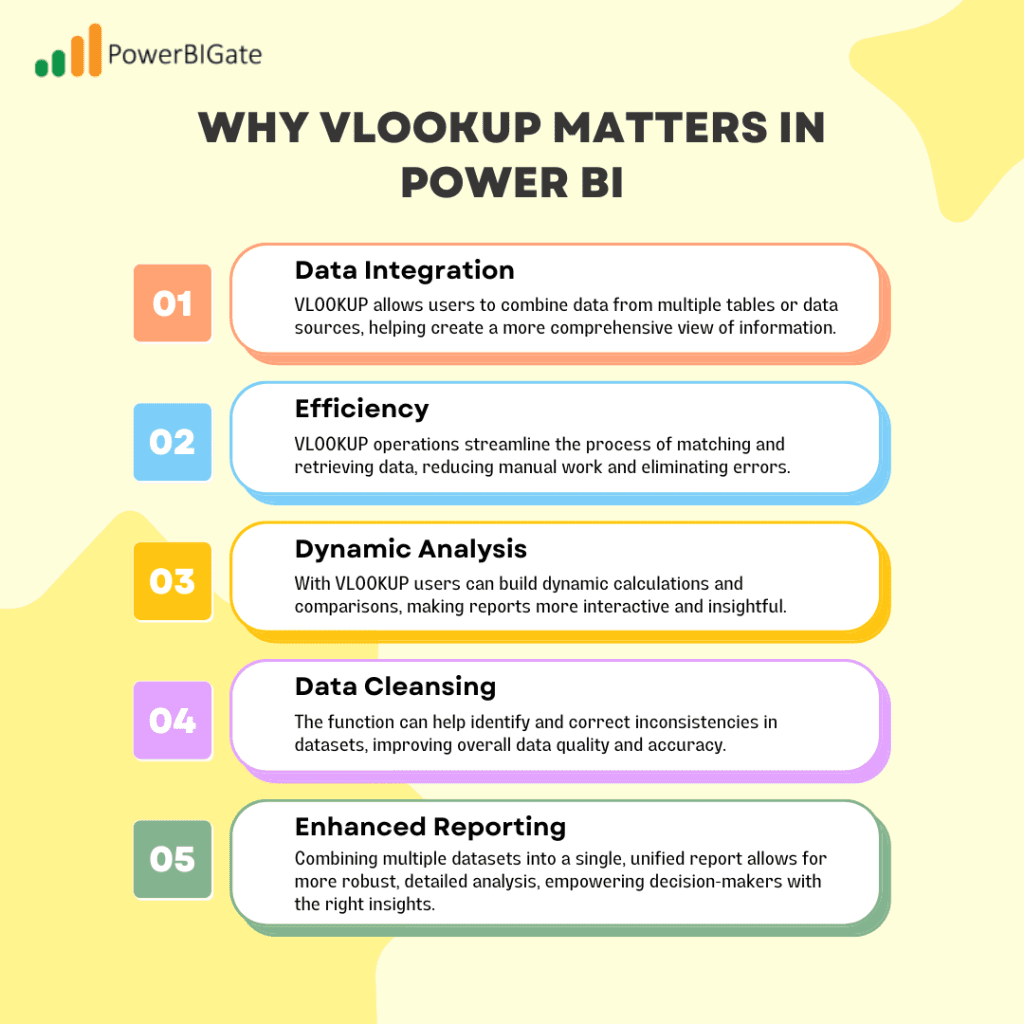
- Data Integration: VLOOKUP allows users to combine data from multiple tables or data sources, helping create a more comprehensive view of information.
- Efficiency: VLOOKUP operations streamline the process of matching and retrieving data, reducing manual work and eliminating errors.
- Dynamic Analysis: With VLOOKUP, users can build dynamic calculations and comparisons, making reports more interactive and insightful.
- Data Cleansing: The function can help identify and correct inconsistencies in datasets, improving overall data quality and accuracy.
- Enhanced Reporting: Combining multiple datasets into a single, unified report allows for more robust, detailed analysis, empowering decision-makers with the right insights.
Power BI’s DAX Functions for VLOOKUP
Power BI doesn’t have a direct VLOOKUP function as found in Excel, but DAX offers several powerful alternatives to achieve similar results. Key functions include:
These functions are instrumental in performing VLOOKUP-like operations in Power BI and enable advanced lookup operations that go beyond what Excel’s VLOOKUP can achieve. Let’s dive into these functions in more detail.
LOOKUPVALUE: The Power BI Equivalent of Excel’s VLOOKUP
LOOKUPVALUE is the closest equivalent to Excel’s VLOOKUP function in Power BI. This DAX function allows you to search for a value in one column and return a corresponding value from another column, all within the same table or even across different tables, assuming relationships are established.
Syntax:
DAX
LOOKUPVALUE(<result_columnName>, <search_columnName>, <search_value>, [<search_columnName>, <search_value>]…)
Example:
Suppose you have a table called “Products” with columns “ProductID” and “ProductName.” To look up the product name for a given ProductID (e.g., 1001), you would use:
DAX
ProductName = LOOKUPVALUE(Products[ProductName], Products[ProductID], 1001)
This formula retrieves the name of the product with ID 1001. LOOKUPVALUE is especially powerful because it allows for multiple conditions or criteria in its lookup.
RELATED: Simplifying Relationships Between Tables
The RELATED function allows users to retrieve a value from a related table, making it easier to perform lookups when tables are connected via relationships. This function simplifies the process of pulling in related data without needing complex joins or manual lookups.
Syntax:
DAX
RELATED(<column>)
Example:
Suppose you have two tables: “Orders” and “Customers,” with a relationship established between them using the “CustomerID” column. To retrieve the customer name for each order, you could use:
DAX
CustomerName = RELATED(Customers[CustomerName])
This formula, when used in the Orders table, will pull the corresponding customer name from the Customers table for each order.
RELATEDTABLE: Working with Multiple Related Records
The RELATEDTABLE function is helpful when you need to work with multiple related records instead of retrieving just a single value. It returns a table containing all the rows related to the current row from another table.
Syntax:
DAX
RELATEDTABLE(<table>)
Example:
If you have a “Customers” table and an “Orders” table, and you want to calculate the total value of orders for each customer, you could use:
DAX
TotalOrderValue = SUMX(RELATEDTABLE(Orders), Orders[OrderAmount])
This formula, when used in the Customers table, sums up all the order amounts for each customer, providing a total order value.
Advanced VLOOKUP Techniques in Power BI
Once you’re comfortable with the basics, you can explore advanced techniques to take your Power BI lookup skills to the next level. These methods will allow you to perform more complex data retrieval operations and customize lookups to fit specific business needs.
1. Multiple Condition Lookups
Sometimes, you may need to match data based on multiple criteria. Power BI allows for this through nested LOOKUPVALUE functions or by using the && (AND) operator.
Example:
DAX
LOOKUPVALUE(Employees[Salary], Employees[Department], “Sales”, Employees[Position], “Manager”, Employees[YearsOfService], 5)
This formula looks up the salary for an employee in the Sales department, who holds the position of Manager, and has 5 years of service. This level of detail is essential for scenarios where simple one-condition lookups are not sufficient.
2. Error Handling in VLOOKUP Operations
When working with large datasets, handling potential errors gracefully is crucial. The IFERROR function can be used alongside LOOKUPVALUE to provide default values when a match isn’t found.
Example:
DAX
ProductDescription = IFERROR(LOOKUPVALUE(Products[Description], Products[ProductID], [CurrentProductID]), “Product not found”)
In this case, the formula will return “Product not found” if LOOKUPVALUE doesn’t find a match, ensuring your report does not break due to missing data.
3. Dynamic VLOOKUP with Variables
For more flexible lookups, you can use variables in DAX. This is particularly useful when the lookup criteria may change based on user input, filters, or slicers in the report.
Example:
DAX
VAR SelectedDepartment = SELECTEDVALUE(DepartmentFilter[Department])
RETURN LOOKUPVALUE(Employees[ManagerName], Employees[Department], SelectedDepartment)
In this example, a variable is used to store the department selected by the user, and then LOOKUPVALUE is used to return the manager’s name for that department. Dynamic lookups are key to creating interactive reports that adapt to user selections.
Optimizing VLOOKUP Performance in Power BI
As datasets grow larger and reports become more complex, optimizing the performance of VLOOKUP operations is critical. Here are some best practices for ensuring that your Power BI reports remain fast and responsive, even with extensive lookups.
1. Use Appropriate Data Types
Ensure that the columns used for lookups have matching data types. Mismatched data types can lead to slower performance and even cause unexpected results. Power BI handles large datasets efficiently, but improper data type usage can result in slower lookups and calculations.
2. Utilize Indexes
Whenever possible, use indexed columns for lookup operations. Indexed columns can significantly speed up the matching process, particularly in large datasets. Indexing is not done manually in Power BI, but you can optimize performance by ensuring that key columns are set appropriately in your data model.
3. Minimize the Use of CALCULATE
While CALCULATE is a powerful function in DAX, it can sometimes slow down reports, especially when used inappropriately for simple lookups. Instead, prefer LOOKUPVALUE or RELATED when possible for basic lookup operations.
4. Leverage Query Folding
Query folding refers to the process where Power BI pushes transformations back to the data source to be executed there, reducing the amount of data transferred. By performing as many operations as possible in the Query Editor before loading the data into your model, you can ensure that DAX calculations are efficient and only act on the necessary data.
5. Use Calculated Columns Instead of Measures for Simple Calculations
In some scenarios, calculated columns can be more efficient than measures. When context transition is not required, using a calculated column for lookups and basic calculations can improve report performance, as these are computed once and stored.
Common VLOOKUP Challenges in Power BI and How to Overcome Them
Even experienced Power BI users encounter challenges when performing VLOOKUP-like operations. Here are some common issues and strategies to overcome them:
1. Handling Many-to-Many Relationships
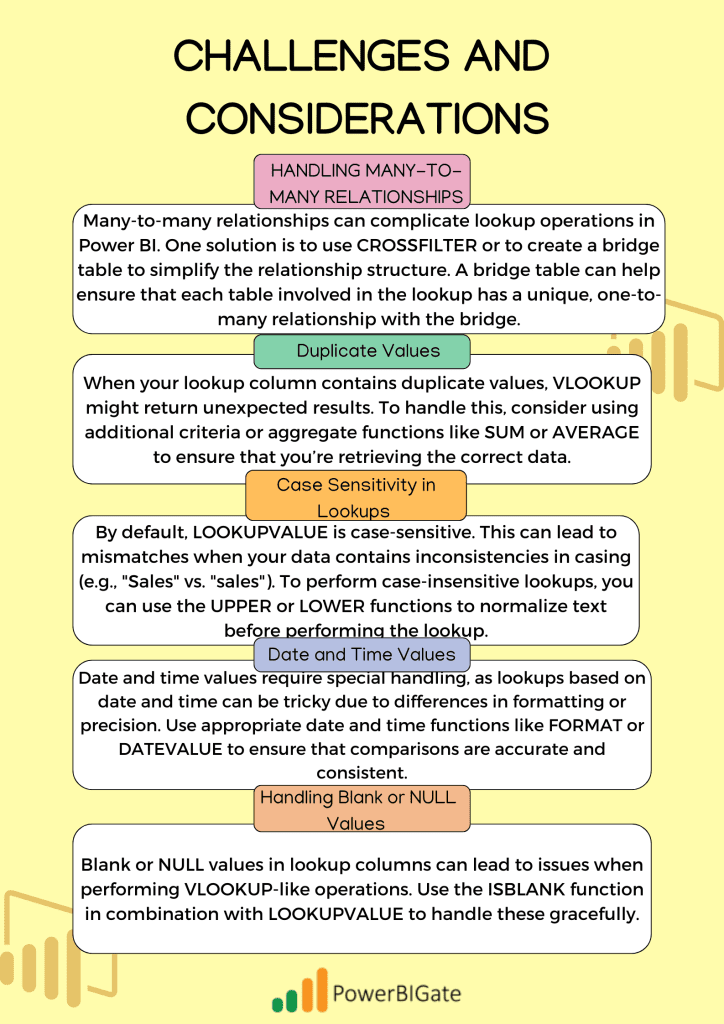
Many-to-many relationships can complicate lookup operations in Power BI. One solution is to use CROSSFILTER or to create a bridge table to simplify the relationship structure. A bridge table can help ensure that each table involved in the lookup has a unique, one-to-many relationship with the bridge.
2. Dealing with Duplicate Values
When your lookup column contains duplicate values, LOOKUPVALUE might return unexpected results. To handle this, consider using additional criteria or aggregate functions like SUM or AVERAGE to ensure that you’re retrieving the correct data.
3. Case Sensitivity in Lookups
By default, LOOKUPVALUE is case-sensitive. This can lead to mismatches when your data contains inconsistencies in casing (e.g., “Sales” vs. “sales”). To perform case-insensitive lookups, you can use the UPPER or LOWER functions to normalize text before performing the lookup.
Example:
DAX
LOOKUPVALUE(Products[Description], UPPER(Products[ProductName]), UPPER([CurrentProductName]))
This formula converts both the lookup value and the search value to uppercase, ensuring a case-insensitive match.
4. Working with Date and Time Values
Date and time values require special handling, as lookups based on date and time can be tricky due to differences in formatting or precision. Use appropriate date and time functions like FORMAT or DATEVALUE to ensure that comparisons are accurate and consistent.
5. Handling Blank or NULL Values
Blank or NULL values in lookup columns can lead to issues when performing VLOOKUP-like operations. Use the ISBLANK function in combination with LOOKUPVALUE to handle these gracefully.
Integrating VLOOKUP with Other Power BI Features
To truly master VLOOKUP in Power BI, it’s essential to understand how it integrates with other features of the platform. Combining VLOOKUP-like functions with additional Power BI capabilities unlocks even more powerful reporting possibilities.
1. VLOOKUP and DAX Measures
VLOOKUP-like operations can be combined with DAX measures to create dynamic, context-aware calculations that respond to user interactions within a report. For example, you could create a measure that performs a lookup based on the current filter context, allowing for real-time updates to the report as users explore different data points.
2. VLOOKUP in Power Query
While DAX is used for lookups in the data model, you can also perform VLOOKUP-like operations in Power Query using the Merge function. This is particularly useful for data preparation, allowing you to combine data from different sources before loading it into Power BI for analysis.
3. VLOOKUP and Parameters
Power BI parameters can be used alongside VLOOKUP to create flexible, user-driven reports. By allowing users to select parameters (e.g., product categories or date ranges), you can dynamically adjust the VLOOKUP criteria and present tailored insights.
4. VLOOKUP and Bookmarks
Bookmarks in Power BI allow users to save specific VLOOKUP scenarios, enabling quick switching between different data views or comparisons. This feature is particularly useful for creating interactive reports where users can explore different dimensions of the data without needing to manually change filters or selections.
5. VLOOKUP in Power BI Service
When publishing reports to the Power BI Service, it’s essential to consider how VLOOKUP operations affect performance and refresh schedules. For large datasets, optimize your lookups to ensure that reports remain responsive, and schedule refreshes during off-peak hours to minimize the impact on server performance.
The Future of VLOOKUP in Power BI
As Power BI continues to evolve, we can expect to see improvements and new features related to VLOOKUP-like operations. Here are some developments to watch for:
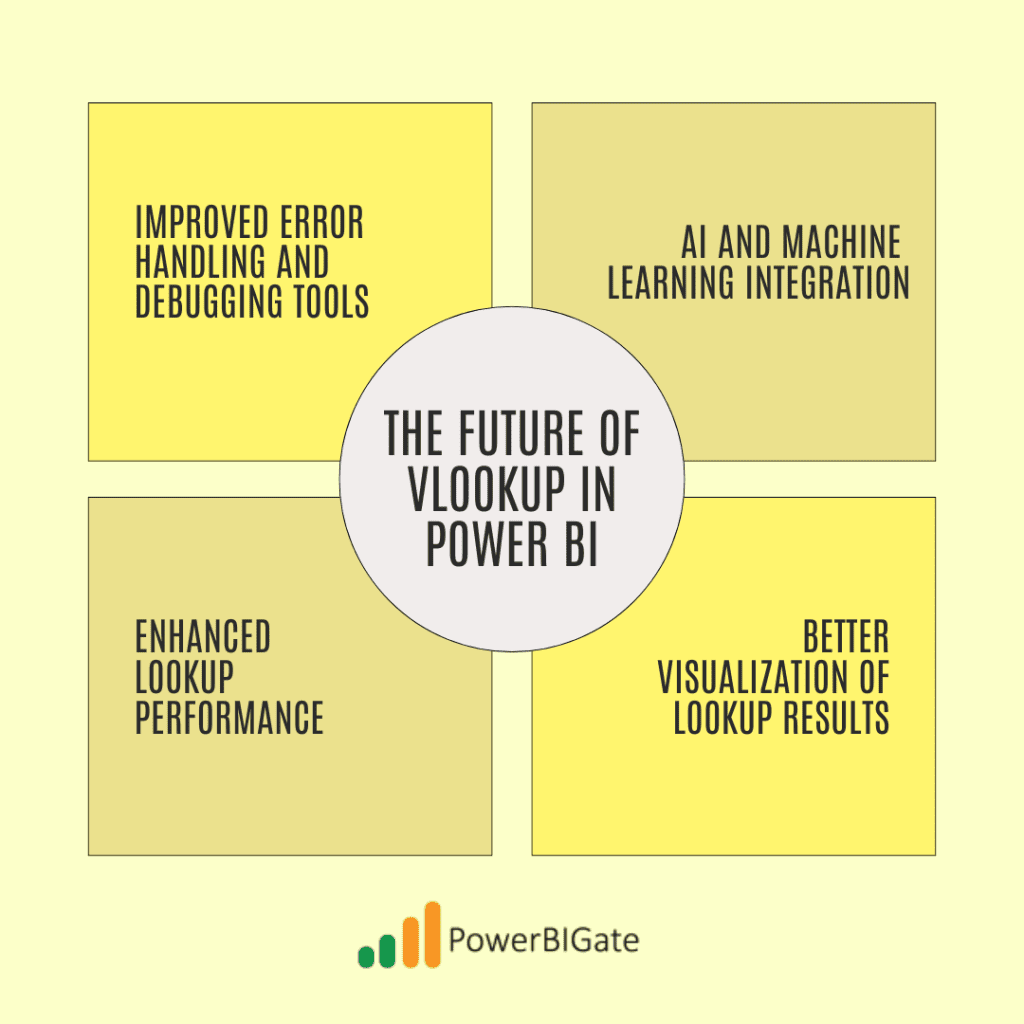
- Improved Error Handling and Debugging Tools: Power BI will likely introduce more advanced error handling and debugging capabilities, allowing users to more easily identify and resolve issues in complex VLOOKUP operations.
- AI and Machine Learning Integration: Power BI’s growing integration with AI and machine learning features could lead to more intelligent lookup capabilities, such as predictive lookups or automatic detection of relationships between data points.
- Enhanced Lookup Performance: Future updates to Power BI may include performance improvements for lookups across large datasets, reducing processing times and improving overall responsiveness.
- Better Visualization of Lookup Results: We can expect expanded options for visualizing lookup results, such as specialized charts or tables that display the results of VLOOKUP operations more clearly and effectively.
Conclusion: Mastering VLOOKUP for Power BI Success
Mastering VLOOKUP functionality in Power BI, implemented through DAX functions like LOOKUPVALUE, RELATED, and RELATEDTABLE, is a cornerstone skill for any serious data analyst or business intelligence professional. By mastering these techniques, you’ll be able to create more insightful, dynamic, and efficient reports that drive better business decisions.
As you continue your journey with Power BI, challenge yourself to find innovative ways to use VLOOKUP operations in your reports. The possibilities are endless, and the insights you uncover could be game-changing for your organization.
Thoughtful Question for Users:
How have you creatively used VLOOKUP-like functions in Power BI to solve complex business problems or uncover hidden insights in your data? Share your experiences and any unique challenges you’ve overcome in the comments below!