In today’s world of data-driven decision-making, Business Intelligence (BI) tools are essential to help organizations transform raw data into actionable insights. Power BI, a leader in the BI space, provides users with the ability to create interactive, dynamic visualizations that respond to user input. This interactivity is made possible by one of the most fundamental concepts in Power BI: cross filter direction. Understanding and mastering this feature can elevate your data analysis capabilities, allowing you to build more insightful and sophisticated reports. This comprehensive guide will explore the concept of cross filter direction in Power BI, its impact on your data models, and how to use it to maximize the value of your data.
What is Cross Filter Direction in Power BI?
Before delving into the specifics of cross filter direction, it’s essential to define it clearly. Cross filter direction in Power BI refers to how filters propagate between tables in a data model. In other words, it determines how a selection in one visual affects other visuals on the same report page by filtering the underlying data. Power BI offers three settings for cross filter direction:
- Single Direction
- Both Directions (Bi-Directional)
- None (No Filtering)
Each setting dictates how relationships between tables influence each other and has a direct effect on the outcome of your visualizations. Depending on the use case, selecting the appropriate cross filter direction is crucial for maintaining data accuracy and achieving optimal performance in your reports.
The Importance of Cross Filter Direction in Data Analysis
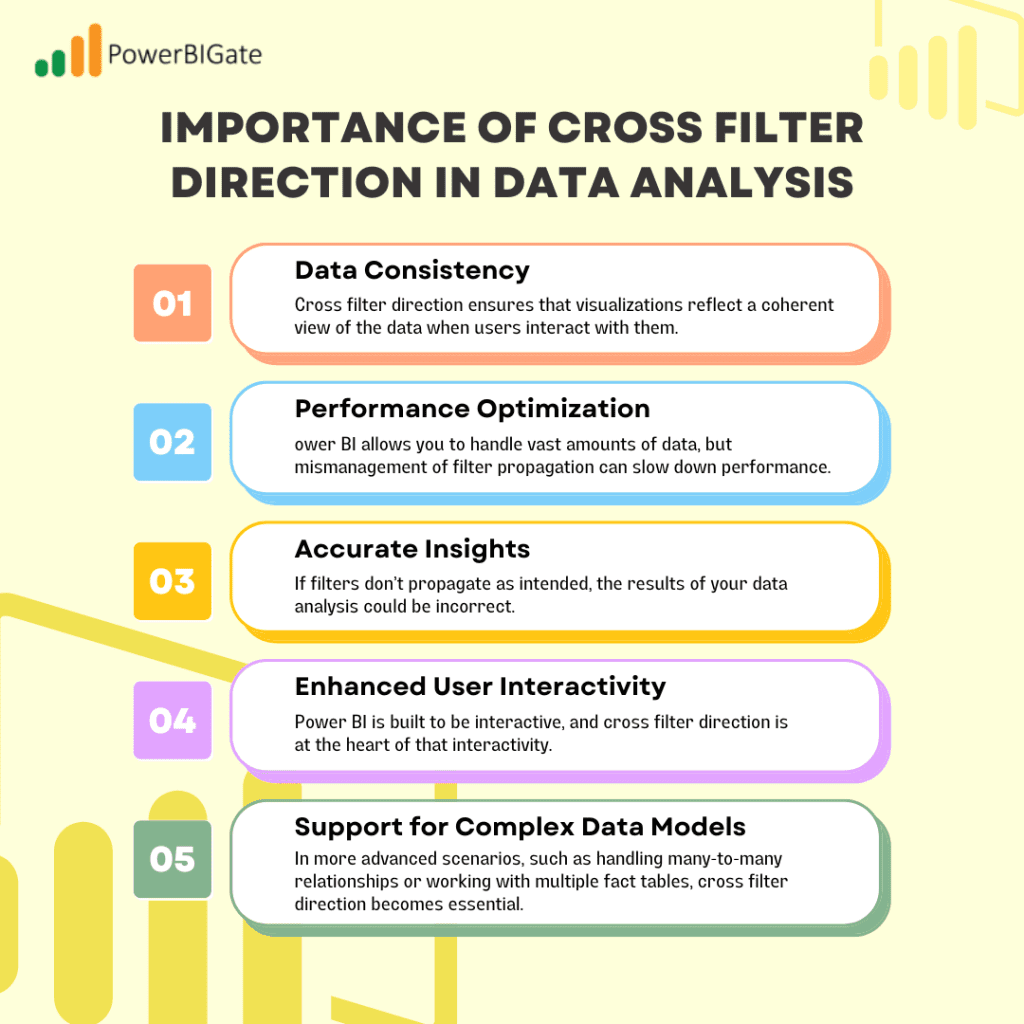
Cross filter direction is much more than just a technical setting in Power BI. It plays a central role in determining how users interact with the data and whether the analysis produces accurate and meaningful insights. Here’s why understanding and controlling cross filter direction is critical:
- Data Consistency:
Cross filter direction ensures that visualizations reflect a coherent view of the data when users interact with them. Without proper cross filtering, certain reports may show misleading or incomplete data, undermining the integrity of the analysis. - Performance Optimization:
Power BI allows you to handle vast amounts of data, but mismanagement of filter propagation can slow down performance. By controlling how filters propagate between tables, you can optimize performance and reduce the computational load on large datasets. - Accurate Insights:
If filters don’t propagate as intended, the results of your data analysis could be incorrect. Faulty cross filter settings can lead to misleading conclusions, damaging decision-making processes that rely on accurate data. - Enhanced User Interactivity:
Power BI is built to be interactive, and cross filter direction is at the heart of that interactivity. A well-implemented cross filter direction setting allows users to drill down into data, explore it from multiple angles, and uncover insights that might not be immediately apparent. - Support for Complex Data Models:
In more advanced scenarios, such as handling many-to-many relationships or working with multiple fact tables, cross filter direction becomes essential. It enables complex analyses that would otherwise be difficult to achieve with a standard filtering approach.

Single Direction Cross Filtering: The Basics
Single direction cross filtering is the default behavior in Power BI. In this mode, filters move from the “one” side of a relationship to the “many” side but not in the reverse direction. To understand the concept, let’s break it down with a simple scenario.
How Single Direction Cross Filtering Works:
- Filters applied to the “one” side of a relationship affect the “many” side.
- Filters applied to the “many” side do not affect the “one” side.
For example, consider two tables: Products and Sales. The Products table is on the “one” side of the relationship, while the Sales table is on the “many” side. If you filter the Products table (e.g., select a specific product category), the associated sales records in the Sales table will also be filtered. However, if you apply a filter to the Sales table (e.g., select a specific date range), it will not affect the products displayed in the Products table.
Advantages of Single Direction Cross Filtering:
- Simplicity:
Single direction filtering is straightforward and predictable. It is easy to understand how filters propagate, making it ideal for straightforward, hierarchical data models. - Performance:
Since filters only propagate in one direction, Power BI requires less computation, making this option faster and more efficient, especially for large datasets. - Prevents Ambiguity:
In some cases, allowing filters to propagate in both directions can create circular dependencies, leading to ambiguity in the data model. Single direction filtering helps avoid this issue by enforcing a clear one-way flow of information.
When to Use Single Direction Cross Filtering:
- Hierarchical Data Models:
Use single direction filtering when you have a clear, hierarchical relationship between tables. For example, “Customers” and “Orders” form a natural hierarchy where you expect filters to flow from customers to orders, but not the other way around. - Performance-Critical Scenarios:
If your data model contains a large number of rows or complex relationships, single direction filtering helps maintain performance without compromising the accuracy of the data. - Avoiding Circular Dependencies:
Single direction filtering helps you avoid creating loops in your data model, which can lead to unpredictable filter behavior.
Both Directions Cross Filtering: Unlocking Bi-Directional Analysis
Bi-directional filtering, also known as “both directions” cross filtering, enables filters to propagate in both directions between related tables. This feature is incredibly powerful but should be used judiciously, as it comes with potential performance and complexity concerns.
How Both Directions Cross Filtering Works:
- Filters applied to either side of the relationship affect both tables.
- Changes in one table can have far-reaching effects throughout your data model.
Continuing with the Products and Sales example:
- Filtering the Products table still filters the associated sales data in the Sales table.
- Now, filtering the Sales table (e.g., selecting a specific date range) will also filter the Products table, showing only the products that had sales during the selected period.
Advantages of Both Directions Cross Filtering:
- Enhanced Interactivity:
Bi-directional filtering creates a highly interactive report experience. Users can explore data from multiple angles, leading to deeper insights. For instance, users could filter sales by date and instantly see which products were sold in that period, or filter by products and see the sales timeline for those products. - Complex Data Models:
Bi-directional filtering simplifies the handling of more complex data models, particularly those involving many-to-many relationships or multiple fact tables. Without bi-directional filtering, these scenarios may require complicated DAX measures or workarounds. - Increased Flexibility:
By allowing filters to flow in both directions, this setting can simplify your data model, reducing the need for extra relationships or complex calculations.


When to Use Both Directions Cross Filtering:
- Many-to-Many Relationships:
When you need to manage relationships where both sides can have multiple matches (e.g., products sold across multiple stores), bi-directional filtering becomes essential for accurate analysis. - Complex Reporting Requirements:
If you have a multi-fact table data model, bi-directional filtering enables more comprehensive cross-table analysis. For example, analyzing customer orders and shipments across different regions could benefit from this setting. - Interactive Dashboards:
Bi-directional filtering enhances user experience in interactive dashboards where users are encouraged to filter and explore data from various dimensions.
Considerations and Pitfalls:
- Performance Impact:
Since filters propagate in both directions, bi-directional filtering adds additional computational overhead. This can slow down report performance, particularly when working with large datasets or complex models. - Ambiguity:
Bi-directional filtering can create ambiguity in filter contexts, especially when multiple filters are applied across different tables. If not carefully managed, this can result in incorrect or unexpected results. - Circular Dependencies:
A significant risk with bi-directional filtering is the creation of circular dependencies. These loops can lead to inconsistent data behavior or outright errors in the model. To mitigate this, carefully design relationships and use single direction filtering where appropriate.
No Cross Filtering: When Isolation is Key
The third option for cross filter direction is None, or no filtering. This setting prevents any filters from propagating between tables. While this might seem counterintuitive, it has specific use cases where isolated data views are required.
How No Cross Filtering Works:
- Filters applied to one table do not affect any other tables in the model.
- Each table operates independently unless explicitly connected through DAX measures or other techniques.
Returning to the Products and Sales example:
- Filtering the Products table does not filter the Sales table, and vice versa. Both tables function independently.
Advantages of No Cross Filtering:
- Isolation:
In some cases, you may want certain visuals to remain isolated from others. No cross filtering allows you to create independent visuals within the same report page, even if they are based on related tables. - Performance:
Disabling cross filtering can improve performance by reducing the complexity of filter propagation. This is especially useful when working with large datasets or when you want to minimize processing time. - Specialized Scenarios:
No cross filtering is useful when you need to show different perspectives of the same data without them affecting each other. For example, you might want to show sales data for a specific region alongside national sales trends without the filters interacting.
When to Use No Cross Filtering:
- Isolated Visuals:
Use no cross filtering when you want to present different datasets side by side on a report page without allowing filters to propagate between them. This is common when comparing different views of the data or presenting summary and detailed data simultaneously. - Reference Tables or Lookups:
If you have reference tables that don’t need to be affected by filters, setting cross filter direction to None ensures that these tables remain independent. - Performance Considerations:
For performance-critical reports where filter propagation might cause delays, using no cross filtering can reduce the computational load and speed up report interactions.
Advanced Techniques: Leveraging Cross Filter Direction for Complex Analysis
Once you’ve mastered the basics of cross filter direction, you can take your Power BI data models to the next level with advanced techniques. Here are a few methods to make the most of cross filter direction in complex scenarios:
1. Handling Many-to-Many Relationships
Many-to-many relationships occur when both tables in a relationship have multiple matches on both sides. In traditional relational databases, many-to-many relationships require bridge tables or complex joins. Power BI simplifies this by allowing direct many-to-many relationships between tables, but cross filter direction plays a key role in making these relationships work effectively.
Implementing Many-to-Many Relationships:
- Step 1: Create a bridge table to link the two related tables.
- Step 2: Set cross filter direction to “Both” between the bridge table and the related tables.
- Step 3: Use DAX measures to handle custom filtering requirements and ensure correct aggregations.
2. Using DAX to Control Filter Propagation
In some cases, you may want to override the default behavior of cross filter direction using DAX. Power BI’s DAX language gives you fine-grained control over how filters propagate through your data model. For example, you can use functions like CALCULATE, REMOVEFILTERS, and ALL to modify filter contexts dynamically.
Example: Controlling Filters with DAX
If you want a specific visual to ignore filters from another table, you can use the REMOVEFILTERS function in your DAX measure:
DAX
Total Sales (Ignore Region Filter) = CALCULATE([Total Sales], REMOVEFILTERS(Region))
In this example, the REMOVEFILTERS function prevents the Region filter from affecting the calculation of Total Sales, allowing the visual to show total sales across all regions, even if a region is selected in another visual.
3. Managing Cross Filter Direction with Multiple Fact Tables
Many Power BI models involve multiple fact tables, such as Sales, Inventory, and Returns. In these cases, using bi-directional cross filtering can simplify the model, but it can also introduce complexity. Managing cross filter direction carefully ensures that the data flows correctly between the different fact tables without creating ambiguous filter contexts.
Best Practices for Multiple Fact Tables:
- Use bridge tables to connect the fact tables.
- Set cross filter direction to “Both” for relationships involving bridge tables, but “Single” for relationships between fact tables and dimension tables.
- Use DAX measures to manage specific filter propagation rules.
Common Pitfalls and How to Avoid Them
Even experienced Power BI users can encounter issues with cross filter direction. Here are some common pitfalls and how to avoid them:
1. Circular Dependencies
Bi-directional filtering can sometimes create circular dependencies, where tables filter each other in an endless loop. To avoid this:
- Use single direction filtering where possible.
- Break the loop by introducing intermediate tables or using DAX measures to control filter propagation.
2. Performance Bottlenecks
Using bi-directional filtering extensively can slow down your reports, particularly with large datasets. To mitigate performance issues:
- Limit the use of bi-directional filtering to essential relationships.
- Consider using aggregation tables or pre-calculated measures to reduce the computational load.
3. Ambiguous Filter Contexts
In complex models, bi-directional filtering can create ambiguous filter contexts, leading to unexpected results. To address this:
- Use DAX functions like REMOVEFILTERS and ALL to control filter contexts explicitly.
- Test your model thoroughly to ensure that filter propagation behaves as expected.
Implementing Cross Filter Direction in Power BI
Here’s a step-by-step guide to adjusting cross filter direction in Power BI:
Step 1: Access the Model View
- Open Power BI Desktop and navigate to the “Model” view.
- In the model view, you will see the relationships between your tables.
Step 2: Modify Relationship Properties
- Click on the relationship line between two tables.
- In the properties pane on the right, locate the “Cross filter direction” dropdown.
Step 3: Choose the Appropriate Cross Filter Direction
- Single: Use this for straightforward, one-way filtering.
- Both: Select this for bi-directional filtering where filters should propagate in both directions.
- None: Choose this when you need to isolate the tables from each other.
Step 4: Test Your Model
Once you’ve set the cross filter direction, test your model by interacting with the visuals on your report page. Make sure the filters behave as expected and that the data updates correctly.


Conclusion
Understanding and effectively managing cross filter direction in Power BI is key to building powerful, interactive, and accurate reports. Whether you’re working with straightforward hierarchical data or complex many-to-many relationships, selecting the right cross filter direction ensures your reports deliver meaningful insights while maintaining performance and clarity. By mastering cross filter direction, you can unlock the full potential of Power BI, enabling users to explore data from multiple perspectives and uncover deeper insights.
As you continue to develop your Power BI skills, remember that cross filter direction is a flexible and powerful tool that, when used correctly, can enhance the interactivity and analytical depth of your reports. With careful planning and consideration of your data model’s structure, you can ensure that your Power BI reports are not only fast and efficient but also insightful and user-friendly.
