Understanding Power BI
power-bi is a powerful business analytics tool developed by Microsoft, designed to enable users to visualize data and share insights across their organizations seamlessly. With its extensive capabilities, Power BI allows users to connect to a wide array of data sources, including databases, cloud services, and spreadsheets, making it an invaluable resource for data-driven decision-making. By transforming raw data into meaningful visualizations, Power BI empowers users to create comprehensive reports and interactive dashboards that facilitate informed decisions and strategic planning.
One of the key features that has contributed to Power BI‘s immense popularity is its user-friendly interface. The platform allows users, regardless of their technical expertise, to easily navigate through its functionalities. With drag-and-drop capabilities, users can effortlessly create compelling visual representations of their data, such as charts, graphs, and maps. This intuitive design reduces the learning curve, enabling teams to quickly adopt and utilize the tool effectively.
In addition to its user-friendly design, Power BI integrates seamlessly with other Microsoft products, such as Excel and Azure. This integration allows users to leverage existing data stored in Excel spreadsheets or utilize Azure’s robust cloud services for data storage and analytics. Furthermore, Power BI’s collaborative features enable users to share insights and reports with stakeholders across the organization, fostering a culture of data-driven decision-making.
The platform also offers advanced analytics capabilities, including natural language processing and machine learning features, which can help organizations uncover hidden trends and patterns within their data. With these powerful tools at their disposal, businesses can drive better outcomes, enhance operational efficiency, and improve overall performance.
Power BI stands out as a versatile and comprehensive business analytics tool that empowers users to visualize data effectively, collaborate with stakeholders, and make informed decisions that can significantly impact organizational success.

The Role of Data in Modern Business
In today’s data-driven world, businesses rely heavily on data to inform their strategies and operations. The explosion of data generated from various sources—such as customer interactions, social media, and IoT devices—has created both challenges and opportunities for organizations. The ability to visualize and analyze this data effectively is critical, as it can lead to more informed decisions, increased efficiency, and ultimately, better business outcomes. Companies that harness the power of data analytics are better equipped to identify trends, understand customer preferences, and anticipate market shifts.
Power BI, Microsoft’s robust business analytics tool, plays a pivotal role in enabling organizations to transform raw data into meaningful insights. By providing a platform for interactive data visualization, Power BI allows users to create comprehensive reports and dashboards that display complex data in an easily digestible format. This capability is crucial for decision-makers, who often need to sift through large volumes of data to extract relevant information quickly.
Furthermore, Power Bi enhances collaboration across departments by allowing teams to share insights and reports seamlessly. This fosters a culture of data-driven decision-making, where employees at all levels can engage with analytics and contribute to strategic discussions. The tool’s integration with other Microsoft products, such as Excel and Azure, further amplifies its effectiveness, as users can leverage existing data while maintaining a cohesive analytics environment.
As organizations strive to remain competitive in an ever-evolving marketplace, the ability to respond quickly to changing market conditions and customer needs becomes paramount. Power BI equips businesses with the analytical tools necessary to not only react to these changes but also to proactively shape their strategies for sustained growth and success. Ultimately, embracing data analytics is no longer just a competitive advantage; it is a necessity for thriving in today’s business landscape.
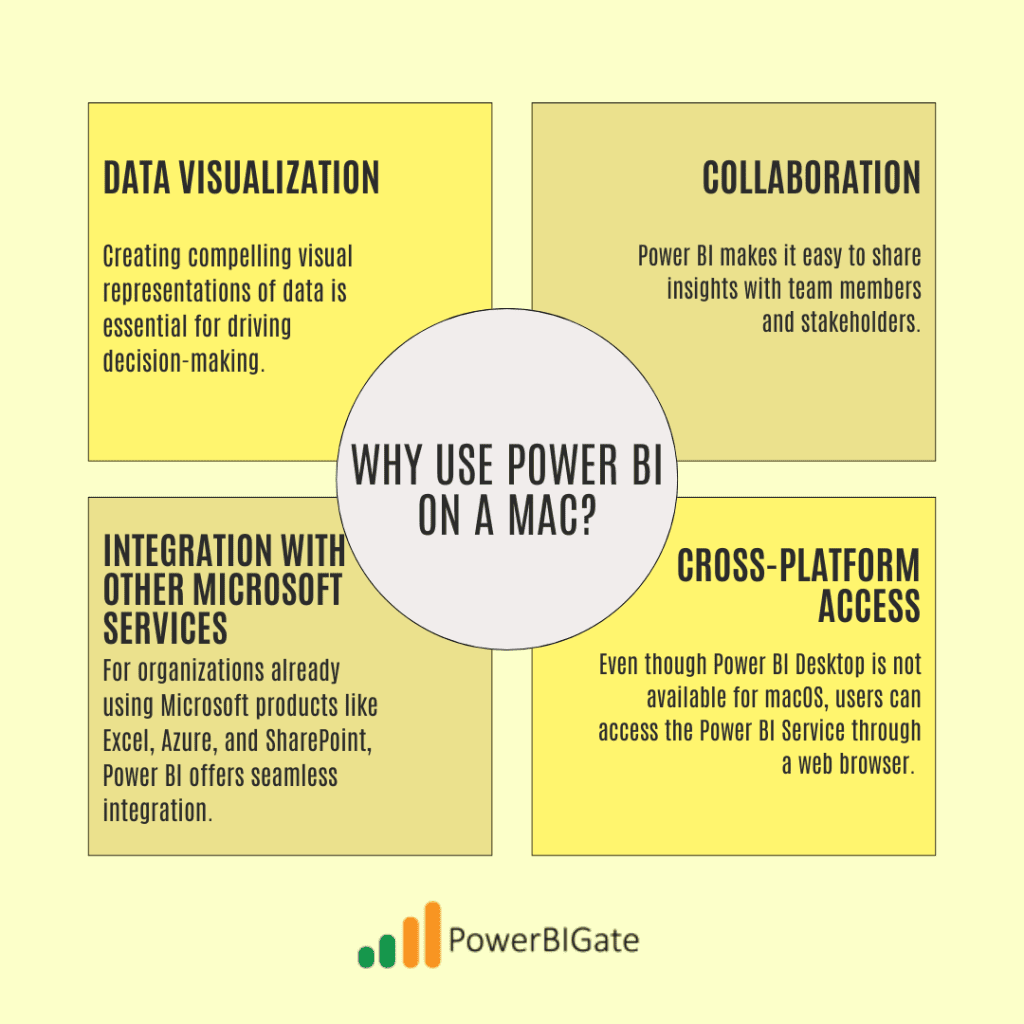
Why Use Power BI on a Mac?
Although Power BI Desktop is not natively available for macOS, many Mac users are eager to utilize this tool for various reasons:
1. Data Visualization
Creating compelling visual representations of data is essential for driving decision-making. Power BI offers a wide range of visualization options, from bar charts and line graphs to complex heat maps and scatter plots. These visualizations can help users quickly grasp trends and outliers in their data.
2. Collaboration
Power BI makes it easy to share insights with team members and stakeholders. Users can publish their reports to the Power BI Service, enabling access for others within the organization. This collaborative environment fosters a culture of data-driven decision-making.
3. Integration with Other Microsoft Services
For organizations already using Microsoft products like Excel, Azure, and SharePoint, Power BI offers seamless integration. This makes it easy to pull data from existing sources and create visualizations without needing extensive data preparation.
4. Cross-Platform Access
Even though Power BI Desktop is not available for macOS, users can access the Power BI Service through a web browser. This allows Mac users to work with their data from anywhere, as long as they have internet access.
How to Download Power BI on a Mac
Since Power BI Desktop is not natively available for macOS, users have several options to access it:
Option 1: Using Virtualization Software
Running Windows on your Mac through virtualization software is one of the most common methods for accessing Power BI. Here’s how:
- Install Virtualization Software: Options include Parallels Desktop, VMware Fusion, or VirtualBox.
- Install Windows: Follow the software instructions to install a Windows operating system on your virtual machine. You will need a valid Windows license for this step.
- Download Power BI Desktop: Once Windows is set up, navigate to the Microsoft website and download Power BI Desktop as you would on a regular Windows PC.
Pros and Cons of Virtualization
- Pros:
- Allows you to run Windows applications alongside macOS without rebooting.
- You can easily switch between macOS and Windows environments.
- Cons:
- Requires significant system resources, potentially slowing down your Mac if you don’t have adequate RAM or processing power.
- There may be a learning curve associated with the virtualization software.
Option 2: Using Boot Camp
Boot Camp is a utility that allows you to install Windows alongside macOS, providing better performance than virtualization. Here’s how to set it up:
- Open Boot Camp Assistant: Find it in the Utilities folder within Applications.
- Install Windows: Follow the prompts to partition your disk and install Windows. This process will require a Windows installation media, such as a USB drive or DVD.
- Download Power BI Desktop: After installation, download Power BI Desktop from the Microsoft website.
Pros and Cons of Boot Camp
- Pros:
- Better performance compared to running Power BI through virtualization.
- Full access to Windows resources.
- Cons:
- Requires rebooting your computer to switch between macOS and Windows.
- Takes up disk space for the Windows partition.
Option 3: Using Power BI Service
If you prefer not to install Windows at all, you can use the online version of Power BI:
- Visit the Power BI Service: Go to app.powerbi.com in your web browser.
- Sign In or Create an Account: Use your Microsoft account or create one if necessary.
- Access Features: While the online version lacks some features of the desktop application, it still offers robust capabilities for data visualization and reporting.
Pros and Cons of Power BI Service
- Pros:
- No need to install Windows or additional software.
- Accessible from any device with internet access.
- Cons:
- Limited features compared to Power BI Desktop.
- Requires a stable internet connection.
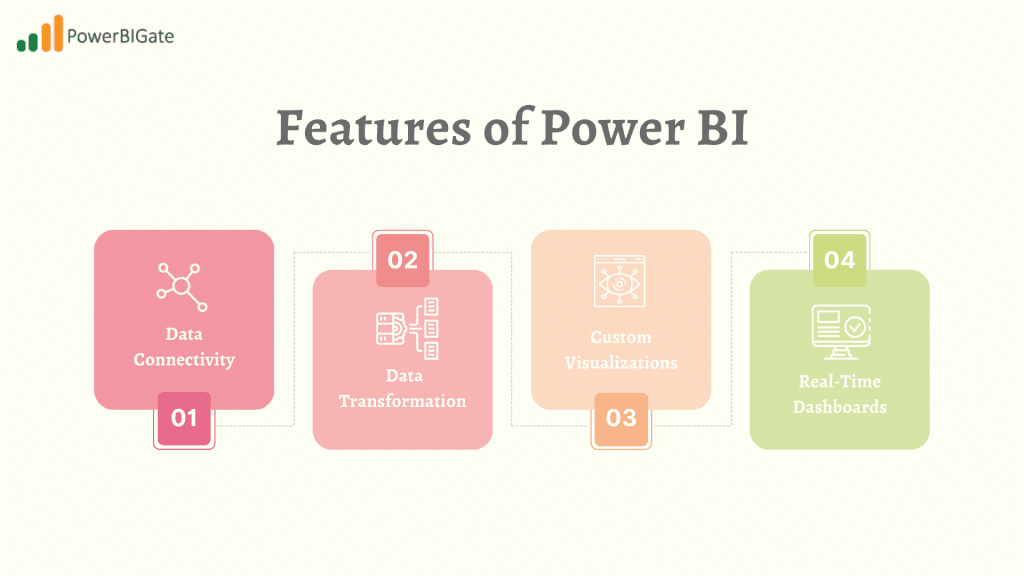
Features of Power BI
Power BI includes several features that enhance data analysis:
1. Data Connectivity
Power BI can connect to various data sources, including databases, online services, and files. Some popular data sources include:
- Microsoft Excel
- SQL Server
- Azure Data Lake
- SharePoint
- Google Analytics
2. Data Transformation
Before visualizing data, users can utilize Power Query for data cleaning and transformation. This includes:
- Merging multiple datasets
- Removing duplicates
- Changing data types
- Creating calculated columns
3. Custom Visualizations
Power BI allows users to create tailored visualizations using custom visuals from the marketplace. Users can choose from a variety of visualizations, including:
- Infographics
- KPI indicators
- Timelines
4. Real-Time Dashboards
Power BI dashboards can monitor real-time data updates through dashboards that refresh automatically. This is particularly useful for businesses that need to track key performance indicators (KPIs) in real-time.
Best Practices for Using Power BI on a Mac
To maximize your experience with Power BI on a Mac, consider these best practices:
1. Optimize Your Data Model
Ensure your data model is efficient by reducing unnecessary columns and tables. This will improve performance when creating reports. Consider the following tips:
- Use data types efficiently (e.g., use numeric types for numerical data).
- Avoid creating complex relationships that can slow down performance.
- Create summary tables for frequently used calculations.
2. Use DAX Effectively
Learn Data Analysis Expressions (DAX) for advanced calculations and aggregations. DAX can significantly enhance your reporting capabilities by allowing you to create custom measures and calculated columns. Here are some common DAX functions to consider:
- SUMX: Calculates the sum of an expression evaluated over a table.
- FILTER: Returns a table that represents a subset of another table or expression.
- CALCULATE: Evaluates an expression in a modified filter context.
3. Regularly Update Your Reports
Keep your reports updated with the latest data by scheduling refreshes or manually refreshing them as needed. Setting up a regular refresh schedule helps ensure that your team is always working with the most current information.
4. Leverage Community Resources
Engage with the Power BI community through forums and user groups. Sharing insights and solutions can enhance your learning experience. Some valuable resources include:
- Microsoft Power BI Community: A forum where users can ask questions and share knowledge.
- YouTube Channels: Numerous content creators offer tutorials and tips on using Power BI effectively.
- Online Courses: Websites like Coursera and Udemy offer comprehensive courses on Power BI.
Alternatives to Power BI for Mac Users
If you find that Power BI does not meet your needs or prefer native applications, consider these alternatives:
1. Tableau
Tableau is a leading data visualization tool that offers a robust feature set for analytics. Its drag-and-drop interface makes it easy for users to create interactive dashboards. Tableau also provides excellent support for collaborative work environments.
Google Data Studio is a free tool that integrates well with Google services like Google Sheets and Google Analytics. It offers collaborative features, making it easy for teams to work together on reports and dashboards.
3. Qlik Sense
Qlik Sense is a powerful analytics platform that provides associative data indexing for intuitive exploration. It offers self-service data visualization capabilities, allowing users to create their own reports without relying on IT.
4. Looker
Looker is a data platform that provides powerful business intelligence and analytics. It integrates well with cloud databases and offers a comprehensive set of tools for data exploration and reporting.
5. Sisense
Sisense is a business intelligence tool that focuses on simplifying complex data analysis. It enables users to create interactive dashboards and visualizations while offering robust backend capabilities for data processing.

Real-World Use Cases for Power BI on a Mac
Understanding how Power BI can be applied in real-world scenarios can provide valuable insights into its effectiveness. Here are a few use cases:
1. Marketing Analytics
Marketers can use Power BI to visualize campaign performance data, such as click-through rates, conversion rates, and ROI. By connecting Power BI to tools like Google Analytics or social media platforms, marketers can create dashboards that provide a clear view of their marketing efforts.
2. Financial Reporting
Finance teams can leverage Power BI to create dynamic financial reports that track expenses, revenue, and profit margins. With real-time data connectivity, finance professionals can quickly identify trends and areas for improvement.
3. Sales Performance
Sales teams can use Power BI to visualize sales data, track performance against targets, and identify opportunities for growth. By creating interactive dashboards, sales professionals can easily share insights with management and make data-driven decisions.
4. Operations Management
Operations teams can utilize Power BI to monitor key operational metrics, such as production efficiency, inventory levels, and supply chain performance. This allows for timely adjustments to processes and helps improve overall operational efficiency.
5. Human Resources Analytics
HR departments can harness Power BI to visualize employee data, such as turnover rates, employee satisfaction scores, and diversity metrics. This data can guide HR strategies and improve employee engagement.
Challenges of Using Power BI on a Mac
While Power BI offers numerous benefits, Mac users may encounter some challenges:
1. Performance Issues
Running Power BI through virtualization or Boot Camp can lead to performance issues, especially if the Mac does not have sufficient hardware resources. It’s essential to ensure that your system meets the necessary requirements for running both macOS and Windows smoothly.
2. Learning Curve
For users who are new to Power BI, there may be a learning curve associated with mastering the tool. Familiarizing yourself with its features and functionalities will take time and practice.
3. Limited Offline Access
Using Power BI Service in a web browser means that users may face limitations when offline. If you need to work without an internet connection, using Power BI Desktop through virtualization or Boot Camp is essential.
4. Compatibility Issues
Certain Power BI features may not work seamlessly when accessed through virtualization or Boot Camp. Users may encounter compatibility issues when attempting to integrate with other software.

Conclusion
While downloading and using Power BI on a Mac requires some workarounds, the benefits of its powerful analytics capabilities make it worthwhile for data enthusiasts and professionals alike. Whether you choose virtualization software, such as Parallels or VMware, install Windows through Boot Camp, or access the online service, you can unlock valuable insights from your data that can drive informed decision-making within your organization.
Engaging with community resources is another critical aspect of maximizing your experience with Power BI. The Power BI community is rich with knowledge, offering forums, tutorials, and user groups where you can ask questions, share experiences, and learn from others. By actively participating in these communities, you can gain valuable insights into best practices, discover new techniques, and stay updated on the latest features and updates.
Optimizing your data models is essential for enhancing performance and efficiency when using Power BI. Focus on simplifying your data structures by reducing unnecessary columns and tables, which can significantly improve report generation times. Additionally, mastering Data Analysis Expressions (DAX) can empower you to create complex calculations and enhance your reporting capabilities.
Leveraging the platform’s robust features, such as real-time dashboards and custom visualizations, can take your data analysis to the next level. With Power BI, you can create compelling reports that clearly communicate your findings to stakeholders.
Moreover, exploring alternative tools may provide further opportunities for data visualization and analysis, especially if you find that Power BI does not fully meet your needs. Options like Tableau, Google Data Studio, and Qlik Sense offer diverse features that might align better with your specific requirements.
In summary, despite some challenges in accessing Power BI on a Mac, its powerful analytics capabilities, coupled with community engagement and optimization strategies, make it a worthwhile investment for anyone serious about data analysis.
What has been your experience using Power BI on a Mac? Have you found any tips or tricks that enhance its functionality? Share your thoughts in the comments below!