Power BI has revolutionized the way businesses handle data analytics and visualization. It empowers users to interact with live data, build dynamic dashboards, and make data-driven decisions with confidence. While these interactive features are widely celebrated, there’s another aspect of Power BI that deserves attention: the ability to export and work with Power BI reports in PDF format.
This comprehensive guide will explore everything you need to know about Power BI PDFs, from creation to optimization, and how to effectively incorporate PDF reporting into your workflow.
Introduction to Power BI PDF
Power BI, Microsoft’s powerful business intelligence (BI) tool, enables users to visualize and analyze data from various sources, including Excel, databases, and web services. While interactive dashboards are at the core of Power BI’s appeal, the ability to export reports to PDF format offers another layer of versatility, making the platform more accessible to a wider audience.
PDF (Portable Document Format) is a globally recognized format for static document sharing. It is an ideal choice for organizations that need to disseminate reports to stakeholders who may not have access to Power BI. Moreover, exporting Power BI reports to PDF can help when users need to review data offline or when a static, easily distributable version of a report is required.
Power BI’s PDF export feature bridges the gap between dynamic data visualization and traditional document sharing, making it an essential tool for any organization looking to distribute insights efficiently.
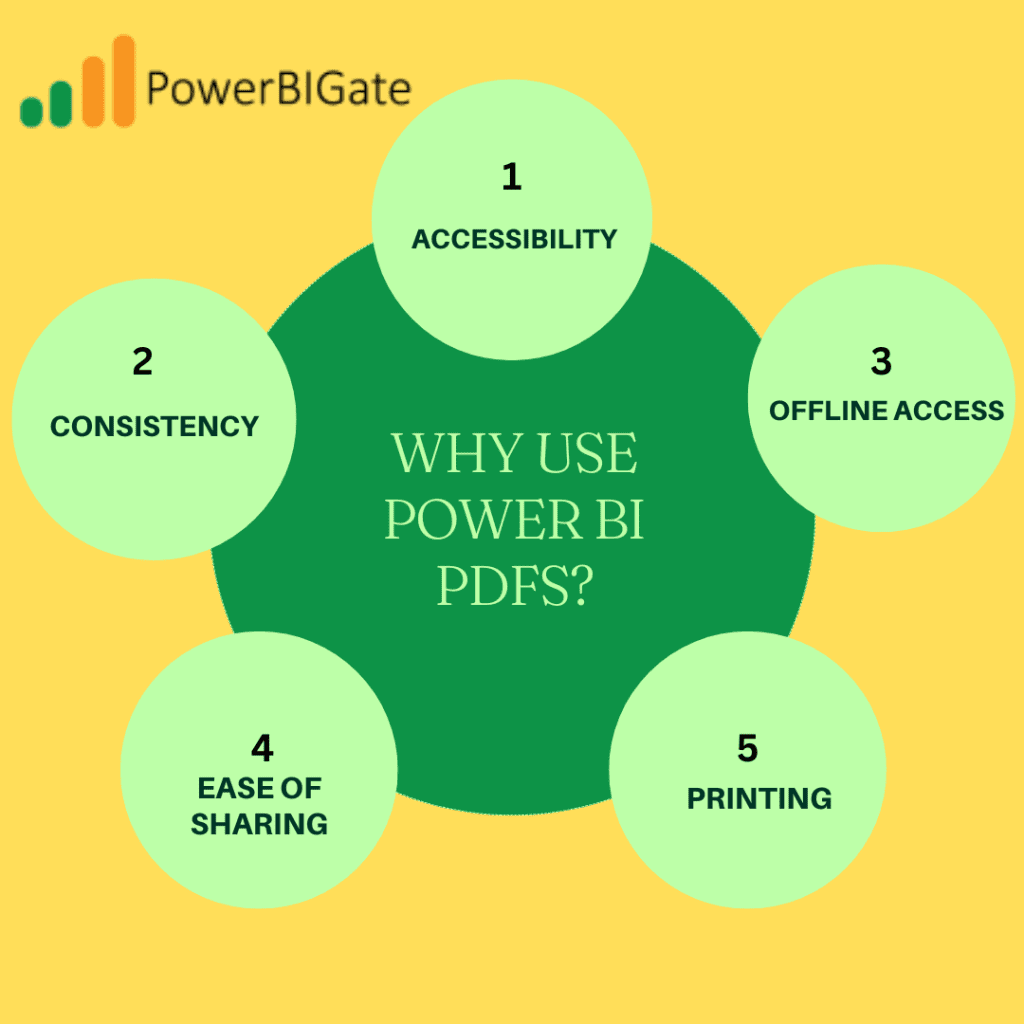
Why Use Power BI PDFs?
Before diving into the technical aspects, it’s important to first understand the key benefits of using Power BI PDFs:
- Accessibility: PDFs can be viewed on almost any device—desktops, tablets, or smartphones—without requiring specialized software like Power BI. This is especially valuable for stakeholders outside the technical or analytical teams.
- Consistency: PDFs preserve the formatting and layout of your report exactly as intended, ensuring that all recipients see the same information in the same way. Unlike web-based reports, PDFs aren’t subject to variations caused by different devices, screen sizes, or browser settings.
- Offline Access: Unlike interactive Power BI reports, which require an internet connection, PDFs can be viewed offline. This is ideal for individuals traveling, in meetings with no Wi-Fi, or simply those who prefer a hard copy of the report.
- Ease of Sharing: PDFs are universally recognized and can be shared via email, cloud storage, or file-sharing platforms like Microsoft OneDrive or Google Drive. This simplicity of distribution allows Power BI PDFs to easily fit into any organization’s communication flow.
- Printing: PDFs are designed to facilitate high-quality printouts, ensuring your reports look professional on paper. Whether for internal presentations or client meetings, Power BI PDFs offer a polished, print-ready solution.
Creating Power BI PDFs: A Step-by-Step Guide
The process of creating PDFs from Power BI is straightforward, but there are some nuances worth considering to get the best results. Here’s a detailed walkthrough:
Step 1: Prepare Your Report
Before exporting your Power BI report to PDF, it’s critical to ensure it’s optimized for static presentation. Unlike interactive reports, PDFs are static documents, meaning users won’t be able to click on filters or drill into data. Make sure your report is fully complete and that key insights are presented clearly without requiring interactivity.
Key considerations:
- Page Size and Orientation: Set your page layout to a standard size like A4 or Letter, and decide whether your report will look best in portrait or landscape orientation.
- Visuals: Choose visuals that can effectively communicate key data points without interactivity. Avoid visuals that rely on user interaction to display information.
- Layout: Ensure the layout is clean and uncluttered to avoid confusion once the report is exported.
Step 2: Access the Export Feature
To export your Power BI report as a PDF:
- Open your report in the Power BI service.
- Click on “File” in the top-left menu.
- Select “Export to PDF” from the drop-down menu.
Step 3: Configure Export Settings
When exporting, you’ll have the option to adjust some key settings:
- Orientation: Choose between landscape and portrait modes.
- Pages to Export: Decide whether to include all pages of the report or just select pages. You can also choose to export hidden pages.
- Page Scaling: Be mindful of how elements scale if you have multiple visuals or large text. Test different scaling options to ensure nothing is cut off.
Step 4: Generate and Save
Click “Export,” and Power BI will begin processing your report. Depending on the complexity of the report, this could take a few moments. Once the PDF is generated, it will be available for download. You can then save the PDF file to your preferred location or share it immediately.
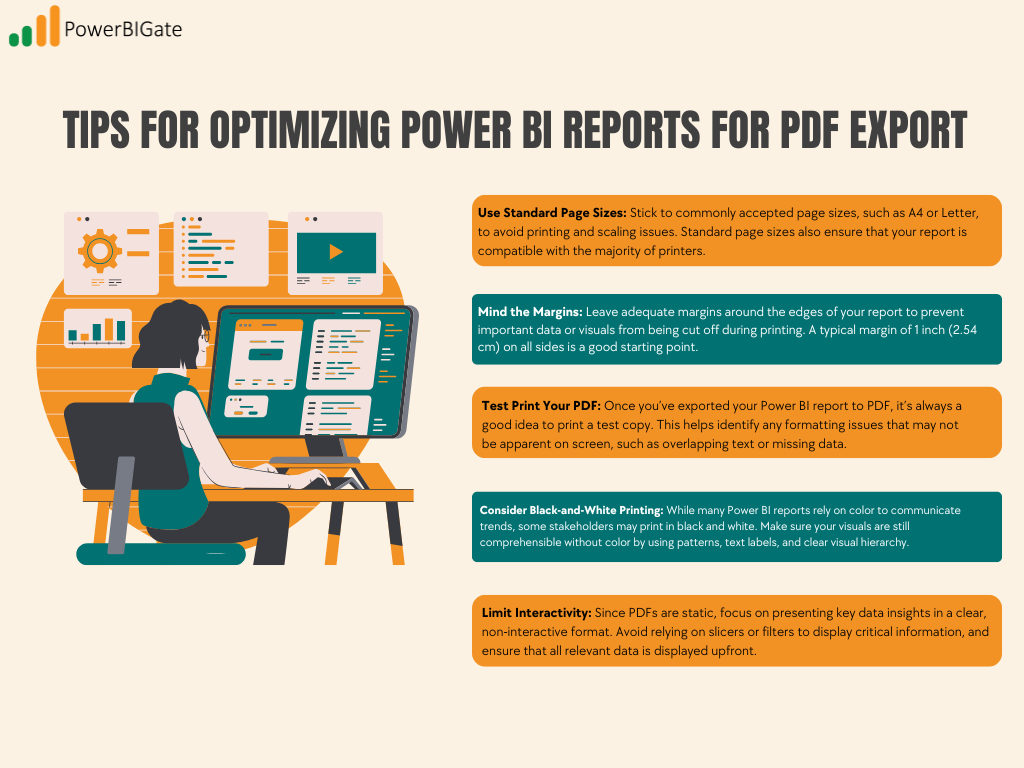
Tips for Optimizing Power BI Reports for PDF Export
To ensure your Power BI PDFs are professional, polished, and clear, it’s crucial to optimize them for the static nature of the format. Here are some advanced tips:
Use Standard Page Sizes
Stick to commonly accepted page sizes, such as A4 or Letter, to avoid printing and scaling issues. Standard page sizes also ensure that your report is compatible with the majority of printers.
Mind the Margins
Leave adequate margins around the edges of your report to prevent important data or visuals from being cut off during printing. A typical margin of 1 inch (2.54 cm) on all sides is a good starting point.
Test Print Your PDF
Once you’ve exported your Power BI report to PDF, it’s always a good idea to print a test copy. This helps identify any formatting issues that may not be apparent on screen, such as overlapping text or missing data.
Consider Black-and-White Printing
While many Power BI reports rely on color to communicate trends, some stakeholders may print in black and white. Make sure your visuals are still comprehensible without color by using patterns, text labels, and clear visual hierarchy.
Limit Interactivity
Since PDFs are static, focus on presenting key data insights in a clear, non-interactive format. Avoid relying on slicers or filters to display critical information, and ensure that all relevant data is displayed upfront.
Advanced Techniques for Power BI PDF Creation
For those looking to take their Power BI PDF exports to the next level, there are several advanced techniques that can enhance your reporting.
Custom Visuals for PDF
Power BI offers a wide variety of custom visuals through its marketplace. Some visuals are specifically designed with PDF export in mind. For example, consider using visuals that emphasize data storytelling, such as advanced bar charts or annotated visuals, which work well in static formats.
Automated PDF Generation
Power Automate (formerly known as Microsoft Flow) is a powerful tool for automating workflows. You can use Power Automate to schedule automated PDF report generation, ensuring that key stakeholders receive updated reports on a regular basis without manual intervention.
Example:
- Set up a workflow that exports a Power BI report to PDF every Friday at 5 PM.
- Automatically email the PDF to your executive team as part of their weekly review package.
Embedding External Content
Power BI allows you to embed external content, such as images or videos, directly into your reports. This can be especially useful in PDFs for adding logos, branding elements, or even QR codes that link back to live reports for further analysis.
Watermarking PDFs
For internal distribution, you might want to consider watermarking your PDFs for confidentiality or version control. This can be done in Power BI by adding text boxes or visual elements to your report before exporting.
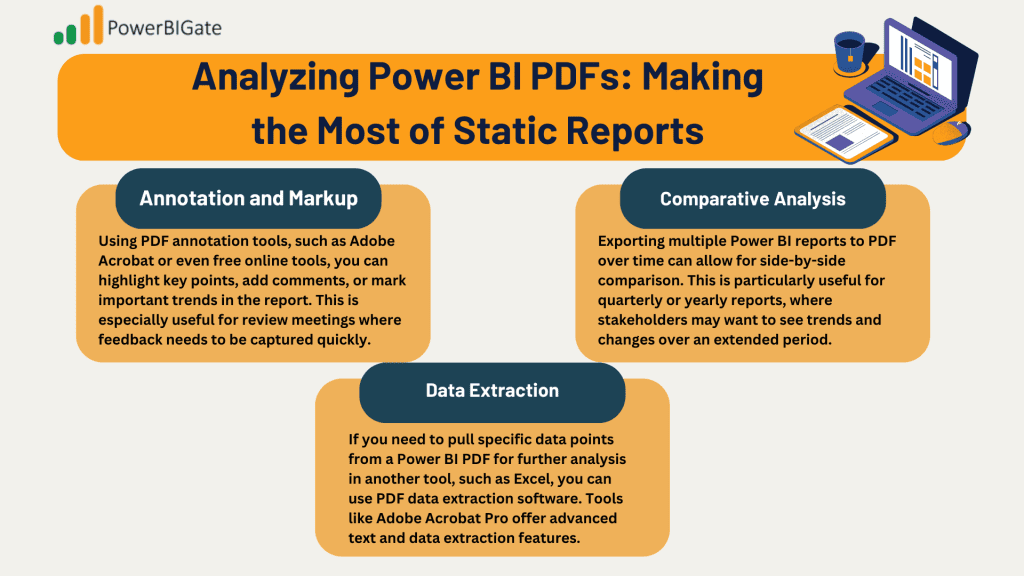
Analyzing Power BI PDFs: Making the Most of Static Reports
While PDFs lack the interactivity of live Power BI reports, they can still be powerful analytical tools when used correctly. Here are some strategies for extracting maximum value from static PDF reports:
Annotation and Markup
Using PDF annotation tools, such as Adobe Acrobat or even free online tools, you can highlight key points, add comments, or mark important trends in the report. This is especially useful for review meetings where feedback needs to be captured quickly.
Comparative Analysis
Exporting multiple Power BI reports to PDF over time can allow for side-by-side comparison. This is particularly useful for quarterly or yearly reports, where stakeholders may want to see trends and changes over an extended period.
Data Extraction
If you need to pull specific data points from a Power BI PDF for further analysis in another tool, such as Excel, you can use PDF data extraction software. Tools like Adobe Acrobat Pro offer advanced text and data extraction features.
Sharing and Collaborating with Power BI PDFs
Distributing Power BI PDFs effectively can drive collaboration and informed decision-making. Here are strategies for seamless sharing:
Secure Distribution
When sharing PDFs containing sensitive or proprietary data, it’s critical to ensure security. Use password protection or encrypted file-sharing platforms like Microsoft OneDrive or SharePoint to maintain control over who can access the PDF.
Version Control
Implementing a version control system is important when distributing Power BI PDFs. Label each version of your report clearly (e.g., Report_v1.0 or Q3_Report_2024) to prevent confusion and ensure that recipients are always working with the most up-to-date data.
Feedback Loop
After distributing your PDF reports, encourage feedback from recipients. Ask whether the format meets their needs, whether any important data was missed, and how future reports can be improved. Creating an iterative feedback loop ensures your reports remain relevant and actionable.
Integrating Power BI PDFs into Your Workflow
To fully leverage the power of Power BI PDFs, it’s important to make them part of your regular business processes. Here are some integration strategies:
Regular Reporting
Set up a recurring process for PDF report generation, whether it’s weekly, monthly, or quarterly. Automating this process using Power Automate ensures that stakeholders consistently receive the information they need without requiring manual effort.
Executive Summaries
Executives often don’t have the time to dig into detailed, interactive reports. Creating concise PDF summaries of longer, interactive Power BI reports ensures that key decision-makers can quickly access the insights they need.
Archiving
Power BI PDFs are an excellent way to create point-in-time snapshots of your data. Archiving these PDFs allows you to create a historical record of how data has evolved over time, which can be invaluable for audits or long-term planning.
Client Deliverables
In client-facing roles, professionalism is key. Incorporating Power BI PDFs into client deliverables, such as project reports, helps create a polished and professional impression, while also showcasing data in a digestible format.
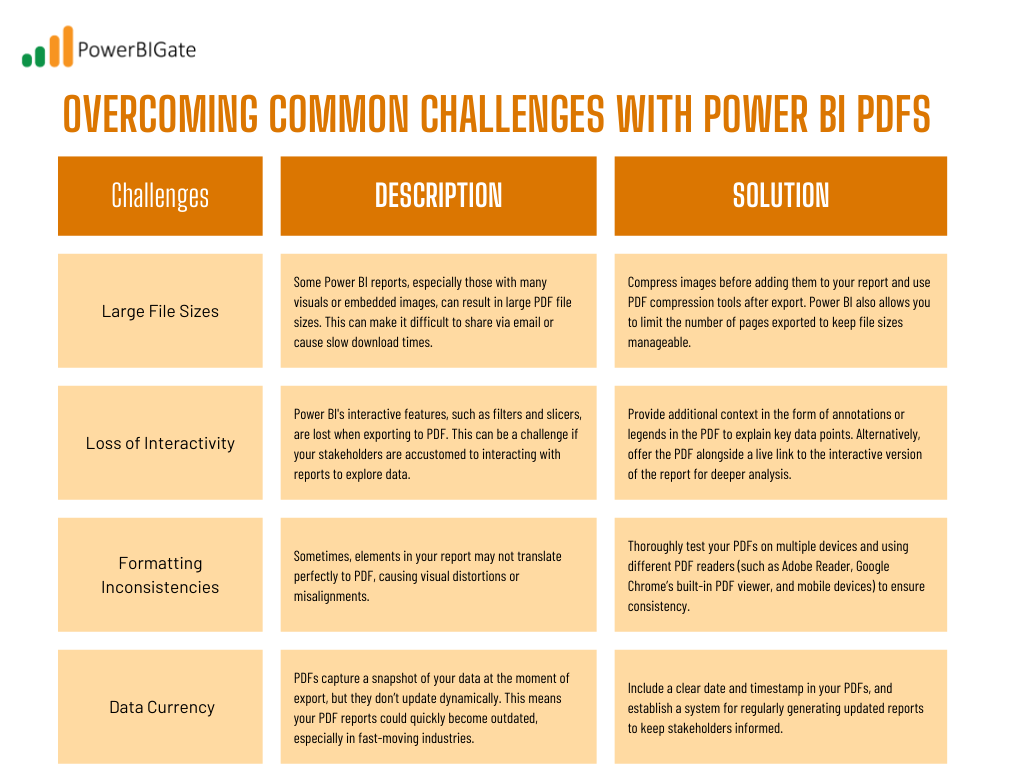
Overcoming Common Challenges with Power BI PDFs
While Power BI PDFs offer numerous advantages, there are also challenges that need to be addressed. Here’s how to overcome some common issues:
Challenge 1: Large File Sizes
Some Power BI reports, especially those with many visuals or embedded images, can result in large PDF file sizes. This can make it difficult to share via email or cause slow download times.
Solution: Compress images before adding them to your report and use PDF compression tools after export. Power BI also allows you to limit the number of pages exported to keep file sizes manageable.
Challenge 2: Loss of Interactivity
Power BI’s interactive features, such as filters and slicers, are lost when exporting to PDF. This can be a challenge if your stakeholders are accustomed to interacting with reports to explore data.
Solution: Provide additional context in the form of annotations or legends in the PDF to explain key data points. Alternatively, offer the PDF alongside a live link to the interactive version of the report for deeper analysis.
Challenge 3: Formatting Inconsistencies
Sometimes, elements in your report may not translate perfectly to PDF, causing visual distortions or misalignments.
Solution: Thoroughly test your PDFs on multiple devices and using different PDF readers (such as Adobe Reader, Google Chrome’s built-in PDF viewer, and mobile devices) to ensure consistency.
Challenge 4: Data Currency
PDFs capture a snapshot of your data at the moment of export, but they don’t update dynamically. This means your PDF reports could quickly become outdated, especially in fast-moving industries.
Solution: Include a clear date and timestamp in your PDFs, and establish a system for regularly generating updated reports to keep stakeholders informed.
The Future of Power BI PDF: Trends and Predictions
As Power BI continues to evolve, we can expect further improvements in its PDF functionality. Here are some trends and innovations to watch for:
Enhanced PDF Interactivity
One future possibility is the development of PDFs that maintain some level of interactivity, such as embedded tooltips or hover-over details. This would help bridge the gap between static and dynamic reports, giving users more control over their viewing experience.
AI-Powered Insights
As Power BI integrates more artificial intelligence (AI) features, we may see the automatic generation of insights or summaries included in PDF reports. These AI-driven insights could help explain trends, outliers, or recommendations alongside the data.
Improved Data Refresh
Another possible innovation is PDFs that update their data automatically when opened, while still maintaining the static PDF format. This could allow organizations to deliver reports that stay current without having to export new PDFs manually.
Better Integration with Microsoft Office
As Power BI continues to deepen its integration with the rest of the Microsoft Office suite, we can expect smoother workflows that allow Power BI PDFs to seamlessly fit into larger business processes. For example, Power BI reports could be embedded into PowerPoint presentations or Word documents without losing quality or interactivity.
Best Practices for Power BI PDF Implementation
To maximize the effectiveness of Power BI PDFs in your organization, follow these best practices:
Establish Clear Guidelines
Create a style guide for your Power BI PDFs that includes rules for formatting, page layout, color usage, and report length. This ensures consistency across your organization, whether you’re creating reports for internal use or client presentations.
Train Your Team
Offer training sessions for your team on how to optimize Power BI reports for PDF export. This training should cover key features, such as page orientation, margin settings, and troubleshooting common formatting issues.
Gather Feedback
Regularly solicit feedback from the recipients of your Power BI PDFs. Ask whether they find the format useful, whether there are any data points missing, and whether they have any suggestions for improvement.
Stay Updated
Power BI is constantly evolving, with new features and updates released regularly. Make sure to stay up-to-date on these changes, as they may introduce new PDF export capabilities or optimization techniques.
Balance Detail and Clarity
It’s important to strike the right balance between providing comprehensive information and overwhelming the reader with too much data. Use clear hierarchies, charts, and visual cues to guide the reader’s eye and focus their attention on the most important insights.
Accessibility Considerations
Ensure your PDFs are accessible to all users, including those with disabilities. This includes adding text descriptions for visuals, using high-contrast colors, and following best practices for document accessibility.

Conclusion
Power BI PDFs offer a versatile solution for sharing data insights in a universally accessible format. By mastering the creation, optimization, and distribution of Power BI PDFs, you can enhance your organization’s reporting capabilities and ensure that crucial data reaches all stakeholders effectively.
As you implement these strategies and explore the possibilities of Power BI PDFs, remember that the key to success lies in balancing the strengths of interactive Power BI reports with the universal accessibility of PDFs. With practice and attention to detail, you can create compelling, informative, and visually appealing reports that drive decision-making and add value to your organization.
Thoughtful Question for Users:
How has incorporating Power BI PDFs into your reporting workflow impacted your organization’s decision-making process, and what challenges or unexpected benefits have you encountered along the way?
