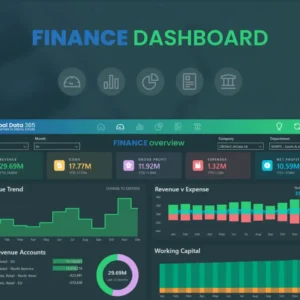
Complete Guide to Power BI Finance Dashboards
Everything CFOs Need to Know About Building Powerful Financial Analytics and Executive Dashboards
📋 Table of Contents
- 1. Introduction to Power BI Finance Dashboards
- 2. Why CFOs Need Power BI Dashboards
- 3. Essential Financial KPIs for CFO Dashboards
- 4. Key Components of Effective Finance Dashboards
- 5. Step-by-Step Guide to Building Your Dashboard
- 6. Best Practices and Design Principles
- 7. Advanced Features for Financial Analysis
- 8. Implementation Strategy
- 9. Common Challenges and Solutions
- 10. Conclusion and Next Steps
🚀 Introduction to Power BI Finance Dashboards
In today's fast-paced business environment, Chief Financial Officers (CFOs) and finance teams need real-time insights to make informed strategic decisions. Power BI finance dashboards have emerged as the cornerstone of modern financial analytics, providing executives with comprehensive visibility into their organization's financial performance, cash flow, profitability, and key performance indicators.
A well-designed Power BI finance dashboard serves as a command center for financial data, transforming complex spreadsheets and disparate data sources into intuitive, interactive visualizations. These dashboards enable CFOs to monitor critical financial metrics, identify trends, spot anomalies, and make data-driven decisions that directly impact the bottom line.
This comprehensive guide will walk you through everything you need to know about creating powerful Power BI finance dashboards that deliver actionable insights and drive business value. From essential KPIs to advanced analytics features, we'll cover the complete spectrum of financial dashboard development.
🎯 Ready to Transform Your Financial Reporting?
Get expert guidance on building powerful Power BI finance dashboards tailored to your organization's needs.
info@powerbigate.com
+1281 631 3767
meet.google.com/qox-sfvk-emm?pli=1
💼 Why CFOs Need Power BI Dashboards
The Modern CFO's Challenge
Today's CFOs face unprecedented challenges: increasing regulatory requirements, complex financial structures, remote workforce management, and the need for real-time decision-making. Traditional financial reporting methods simply cannot keep pace with modern business demands.
Key Benefits of Power BI Finance Dashboards
🔍 Real-Time Visibility
Monitor financial performance as it happens with live data connections to your ERP, CRM, and other business systems. No more waiting for month-end reports to understand your financial position.
📊 Comprehensive Analysis
Combine data from multiple sources to create a holistic view of your organization's financial health, including P&L statements, cash flow analysis, and budget vs. actual comparisons.
⚡ Faster Decision Making
Access critical financial insights instantly, enabling rapid response to market changes, investment opportunities, and potential risks before they impact your bottom line.
🎯 Strategic Planning
Leverage predictive analytics and forecasting capabilities to model different scenarios and make informed strategic decisions about future investments and resource allocation.
ROI Impact of Financial Dashboards
Organizations implementing Power BI finance dashboards typically see significant returns on investment. According to industry research, companies report average time savings of 60-80% in financial reporting processes, improved forecast accuracy by 25-40%, and enhanced decision-making speed by up to 5x. The ability to identify cost-saving opportunities and revenue optimization strategies often pays for the dashboard implementation within the first quarter.
📈 Essential Financial KPIs for CFO Dashboards
The foundation of any effective Power BI finance dashboard lies in selecting and displaying the right Key Performance Indicators (KPIs). These metrics should align with your organization's strategic objectives and provide actionable insights for financial decision-making.
Core Financial Metrics
| KPI Category | Key Metrics | Purpose | Frequency |
|---|---|---|---|
| Profitability | Revenue, Gross Margin, EBITDA, Net Profit Margin | Measure overall financial performance | Daily/Weekly |
| Liquidity | Cash Flow, Working Capital, Current Ratio | Monitor short-term financial health | Daily |
| Efficiency | ROA, ROE, Asset Turnover, Inventory Turnover | Evaluate operational effectiveness | Monthly |
| Growth | Revenue Growth, Customer Acquisition Cost, LTV | Track business expansion | Monthly/Quarterly |
| Risk Management | Debt-to-Equity, Interest Coverage, Credit Risk | Assess financial stability | Monthly |
Sample KPI Performance Dashboard Layout
Industry-Specific KPIs
Different industries require specialized financial metrics to truly understand performance. Manufacturing companies might focus on inventory turnover and cost of goods sold, while SaaS companies prioritize Monthly Recurring Revenue (MRR), Customer Lifetime Value (CLV), and churn rates. Retail organizations often emphasize same-store sales growth and inventory management metrics.
🎯 Pro Tip: The Rule of 5-7-5
Follow the dashboard design principle of 5-7-5: no more than 5 main KPI categories, 7 primary metrics per view, and 5 seconds to understand any chart. This ensures your dashboard remains focused and actionable rather than overwhelming.
🏗️ Key Components of Effective Finance Dashboards
A comprehensive Power BI finance dashboard consists of several interconnected components, each serving a specific purpose in the overall financial analysis framework. Understanding these components and their relationships is crucial for building dashboards that truly serve executive decision-making needs.
Executive Summary View
The executive summary serves as the landing page of your CFO dashboard, providing a high-level overview of the organization's financial health. This view should display the most critical KPIs in an easily digestible format, allowing executives to quickly assess performance and identify areas requiring attention.
- Key Performance Cards: Large, prominent displays of critical metrics like total revenue, net profit, and cash position
- Trend Indicators: Visual cues showing whether metrics are trending up, down, or remaining stable
- Alert Systems: Color-coded warnings for metrics that fall outside acceptable ranges
- Period Comparisons: Year-over-year, quarter-over-quarter, and month-over-month comparisons
Detailed Financial Analysis
Beyond the executive summary, your dashboard should provide drill-down capabilities for deeper financial analysis. This section enables CFOs and finance teams to investigate specific areas of concern or opportunity identified in the high-level view.
✅ Essential Components
- Interactive P&L statements with drill-down capabilities
- Cash flow analysis with forecasting
- Budget vs. actual variance analysis
- Department/division performance comparison
- Customer profitability analysis
- Product line financial performance
⚠️ Components to Avoid
- Overly complex charts that require explanation
- Too many colors that confuse rather than clarify
- Static reports that don't allow interaction
- Outdated or inconsistent data sources
- Metrics that don't align with business objectives
- Charts without clear context or benchmarks
Forecasting and Scenario Analysis
Modern CFO dashboards must include predictive capabilities that help executives plan for the future. Power BI's built-in forecasting features, combined with scenario analysis tools, enable financial teams to model different business conditions and their potential impact on financial performance.
Forecasting Dashboard Components
🔨 Step-by-Step Guide to Building Your Dashboard
Creating an effective Power BI finance dashboard requires careful planning, proper data preparation, and thoughtful design. This step-by-step approach ensures your dashboard delivers maximum value while maintaining usability and performance.
Phase 1: Planning and Requirements Gathering
Before diving into Power BI, invest time in understanding your stakeholders' needs and defining clear objectives for your finance dashboard. This planning phase is critical for project success and user adoption.
- Stakeholder Interviews: Conduct detailed interviews with CFO, finance team members, and other executives who will use the dashboard
- Use Case Definition: Document specific scenarios where the dashboard will be used (board meetings, monthly reviews, ad-hoc analysis)
- KPI Prioritization: Rank financial metrics based on business impact and decision-making importance
- Data Source Inventory: Catalog all available data sources including ERP systems, spreadsheets, and external data feeds
- Update Frequency Requirements: Determine how often data needs to be refreshed for different metrics
Phase 2: Data Architecture and Modeling
Proper data modeling is the foundation of any successful Power BI implementation. For finance dashboards, this involves creating relationships between different data sources and establishing a unified semantic model.
| Data Modeling Step | Key Considerations | Best Practices |
|---|---|---|
| Data Extraction | ERP integration, API connections, flat file imports | Use Power Query for data transformation, establish automated refresh schedules |
| Data Cleaning | Handle missing values, standardize formats, remove duplicates | Document all transformation steps, validate data quality regularly |
| Relationship Design | Chart of accounts mapping, time dimension setup, organizational hierarchy | Use star schema design, optimize for performance and usability |
| Calculated Measures | DAX formulas for KPIs, time intelligence functions, variance calculations | Create reusable measure groups, follow consistent naming conventions |
Phase 3: Dashboard Design and Development
With your data model in place, focus on creating intuitive and visually appealing dashboard interfaces. Remember that your primary audience consists of busy executives who need to quickly understand complex financial information.
Visual Selection
Choose appropriate chart types for different data: line charts for trends, bar charts for comparisons, gauges for performance against targets, and tables for detailed breakdowns.
Color Strategy
Implement consistent color coding: green for positive performance, red for alerts, blue for neutral information, and grey for inactive or historical data.
Layout Design
Follow the "inverted pyramid" principle: most important information at the top, supporting details below, with logical flow from left to right.
Interactivity
Implement cross-filtering, drill-down capabilities, and interactive slicers to enable self-service analytics while maintaining dashboard performance.
✨ Best Practices and Design Principles
Creating effective Power BI finance dashboards requires adherence to proven design principles and best practices. These guidelines ensure your dashboards are not only visually appealing but also functional, performant, and user-friendly.
Design Principles for Financial Dashboards
The Golden Rules of Financial Dashboard Design
- Clarity Over Complexity: Every element should have a clear purpose and contribute to understanding
- Context is King: Always provide benchmarks, targets, and historical comparisons
- Consistency Creates Confidence: Use consistent formatting, colors, and layouts across all views
- Speed of Insight: Users should understand key messages within 10 seconds of viewing
Performance Optimization
Finance dashboards often handle large volumes of transactional data, making performance optimization critical for user adoption and satisfaction. Implement these strategies to ensure your dashboards load quickly and respond smoothly to user interactions.
- Data Model Optimization: Use star schema design, remove unnecessary columns, and optimize DAX calculations
- Aggregation Strategies: Pre-aggregate data at appropriate levels, use composite models when necessary
- Visual Optimization: Limit the number of visuals per page, use bookmarks for complex interactions
- Refresh Optimization: Schedule incremental refreshes, use partitioning for large tables
Security and Governance
Financial data requires the highest levels of security and governance. Implement row-level security (RLS) to ensure users only see data relevant to their role and responsibilities. Establish clear data governance policies covering data quality, access controls, and audit trails.
🔒 Need Help with Security Implementation?
Our experts can help you implement robust security measures and governance frameworks for your Power BI finance dashboards.
info@powerbigate.com
+1281 631 3767
meet.google.com/qox-sfvk-emm?pli=1
🚀 Advanced Features for Financial Analysis
Modern Power BI finance dashboards can leverage advanced analytics capabilities to provide deeper insights and predictive capabilities. These features transform traditional reporting into forward-looking business intelligence that drives strategic decision-making.
AI-Powered Analytics
Power BI's AI capabilities can automatically identify trends, anomalies, and patterns in your financial data. The Quick Insights feature can uncover hidden relationships in your data, while the Decomposition Tree visual helps explain the factors driving key metrics.
Advanced DAX Functions for Financial Analysis
| Function Category | Key Functions | Financial Use Cases |
|---|---|---|
| Time Intelligence | DATEADD, SAMEPERIODLASTYEAR, TOTALYTD | Year-over-year comparisons, rolling averages, YTD calculations |
| Statistical Functions | AVERAGE, MEDIAN, PERCENTILE | Benchmarking, outlier detection, performance distribution analysis |
| Financial Functions | IRR, NPV, PMT | Investment analysis, loan calculations, financial modeling |
| Filtering Functions | CALCULATE, FILTER, ALL | Dynamic segmentation, conditional aggregations, context modification |
Integration with Excel and Power Platform
Leverage the full Microsoft ecosystem by integrating your Power BI finance dashboards with Excel for detailed analysis and Power Platform for automated workflows. This integration enables seamless data flow between budgeting processes in Excel and dashboard visualization in Power BI.
Advanced Analytics Architecture
⚙️ Implementation Strategy
Successful implementation of Power BI finance dashboards requires a structured approach that considers technical requirements, change management, and user adoption strategies. A phased implementation approach minimizes risk while delivering incremental value to the organization.
Implementation Phases
Phase 1: Foundation (Weeks 1-4)
- Infrastructure setup and licensing
- Data source connectivity
- Basic data model creation
- Core KPI calculations
Phase 2: Core Dashboards (Weeks 5-8)
- Executive summary dashboard
- P&L and cash flow views
- Budget vs. actual analysis
- Basic drill-down capabilities
Phase 3: Advanced Features (Weeks 9-12)
- Forecasting and scenario analysis
- Advanced visualizations
- Mobile optimization
- Security implementation
Phase 4: Optimization (Weeks 13-16)
- Performance tuning
- User training and adoption
- Documentation and governance
- Continuous improvement processes
Change Management Considerations
Technology implementation is only half the battle; successful adoption requires effective change management. Engage stakeholders early in the process, provide comprehensive training, and establish clear communication channels for feedback and support requests.
🎯 Success Factors for Implementation
- Executive Sponsorship: Ensure strong support from the CFO and senior leadership
- User-Centric Design: Involve end users throughout the design and testing process
- Iterative Approach: Release features incrementally and gather feedback continuously
- Training and Support: Provide comprehensive training and ongoing support resources
⚠️ Common Challenges and Solutions
Even well-planned Power BI finance dashboard implementations can encounter challenges. Understanding these common pitfalls and their solutions helps ensure project success and long-term value realization.
Data Quality and Integration Challenges
Financial data often comes from multiple systems with varying formats, update frequencies, and quality standards. Poor data quality is the leading cause of dashboard project failures, making data governance and quality management critical success factors.
| Challenge | Impact | Solution | Prevention |
|---|---|---|---|
| Inconsistent Chart of Accounts | Inaccurate financial reporting | Create mapping tables and standardization rules | Establish data governance policies |
| Late Data Updates | Outdated dashboard information | Implement automated refresh schedules | Design refresh monitoring and alerts |
| Missing Historical Data | Limited trend analysis capabilities | Data reconstruction or estimation methods | Archive data systematically from project start |
| Performance Issues | Slow dashboard load times | Optimize data models and calculations | Follow performance best practices from design |
User Adoption Challenges
Technical excellence means nothing without user adoption. Many organizations struggle with getting finance teams to embrace new dashboard tools, often due to inadequate training, poor user experience design, or resistance to change.
✅ Adoption Accelerators
- Involve users in design process
- Provide hands-on training sessions
- Create quick reference guides
- Establish power user networks
- Celebrate early wins and success stories
- Provide ongoing support and feedback channels
❌ Adoption Barriers
- Complex interfaces that require training
- Lack of mobile accessibility
- Poor performance or reliability
- Insufficient training and support
- Resistance to changing established processes
- Competing priorities and time constraints
Scalability and Maintenance
As organizations grow and requirements evolve, finance dashboards must scale accordingly. Plan for future expansion by implementing flexible data architectures, establishing clear governance processes, and creating comprehensive documentation for ongoing maintenance.
🎯 Conclusion and Next Steps
Power BI finance dashboards represent a transformative opportunity for CFOs and finance teams to enhance decision-making capabilities, improve operational efficiency, and drive business value. The key to success lies in careful planning, thoughtful design, and a commitment to continuous improvement based on user feedback and changing business requirements.
Key Takeaways
- Start with Clear Objectives: Define specific business outcomes and KPIs before beginning development
- Prioritize Data Quality: Invest in proper data governance and quality management from the start
- Design for Users: Focus on user experience and adopt iterative design approaches
- Plan for Scale: Build flexible architectures that can grow with your organization
- Measure Success: Establish metrics for dashboard effectiveness and user adoption
Immediate Action Steps
- Assess Current State: Evaluate your existing financial reporting processes and identify improvement opportunities
- Define Requirements: Work with stakeholders to document specific dashboard requirements and success criteria
- Plan Implementation: Create a detailed project plan with realistic timelines and resource requirements
- Start Small: Begin with a pilot project focusing on the most critical KPIs and gradually expand functionality
- Build Capabilities: Invest in training and skill development for your team or consider external expertise
Long-term Success Strategies
Successful Power BI finance dashboard implementations require ongoing attention and continuous improvement. Establish regular review cycles to assess dashboard performance, gather user feedback, and identify new requirements. Stay current with Power BI updates and new features that could enhance your financial analytics capabilities.
Consider establishing a center of excellence for business intelligence within your organization to share best practices, provide ongoing support, and drive innovation in financial analytics. This investment in organizational capability building pays dividends through improved decision-making and competitive advantage.
🚀 Ready to Get Started?
Transform your financial reporting and analysis with expertly designed Power BI dashboards. Our team specializes in creating powerful, user-friendly finance dashboards that deliver real business value.
info@powerbigate.com
+1281 631 3767
meet.google.com/qox-sfvk-emm?pli=1
Get a free consultation and discover how Power BI finance dashboards can transform your organization's financial analytics capabilities.
🔗 Related Resources
Explore these additional resources to further enhance your Power BI finance dashboard knowledge:


