In today’s data-driven world, organizations are constantly seeking ways to leverage their data to gain a competitive edge. Microsoft Power BI is a leading business intelligence platform that enables businesses to visualize and analyze data, providing valuable insights for better decision-making. With the rapid advancements in Artificial Intelligence (AI), Power BI has incorporated built-in AI features that revolutionize how businesses interact with their data.This article will explore the AI capabilities within Power BI, providing an in-depth understanding of how these features work and the benefits they bring to data analysis. By the end, you should have a clear grasp of how to leverage Power BI’s AI functions to unlock smarter insights and drive data-driven success.
Understanding Artificial Intelligence in Power BI
At its core, Artificial Intelligence in Power BI revolves around augmenting human intelligence with machine learning and natural language processing. The goal is to automate certain data analysis tasks, provide intelligent data insights, and enable users to interact with data more naturally and efficiently.Power BI’s AI features are designed to assist users in three key ways:
- Automated Insights: Power BI can automatically identify patterns, trends, and anomalies in data, providing users with quick insights that might otherwise be missed.
- Advanced Data Modeling: AI enhances the accuracy of data modeling, making predictions, and forecasting more reliable.
- Natural Language Interactions: Users can interact with their data using natural language, making data exploration and analysis more accessible and intuitive.
By combining these capabilities, Power BI’s AI functions save time, improve the accuracy of insights, and make data analysis more democratic, empowering users of all skill levels to derive value from their data.
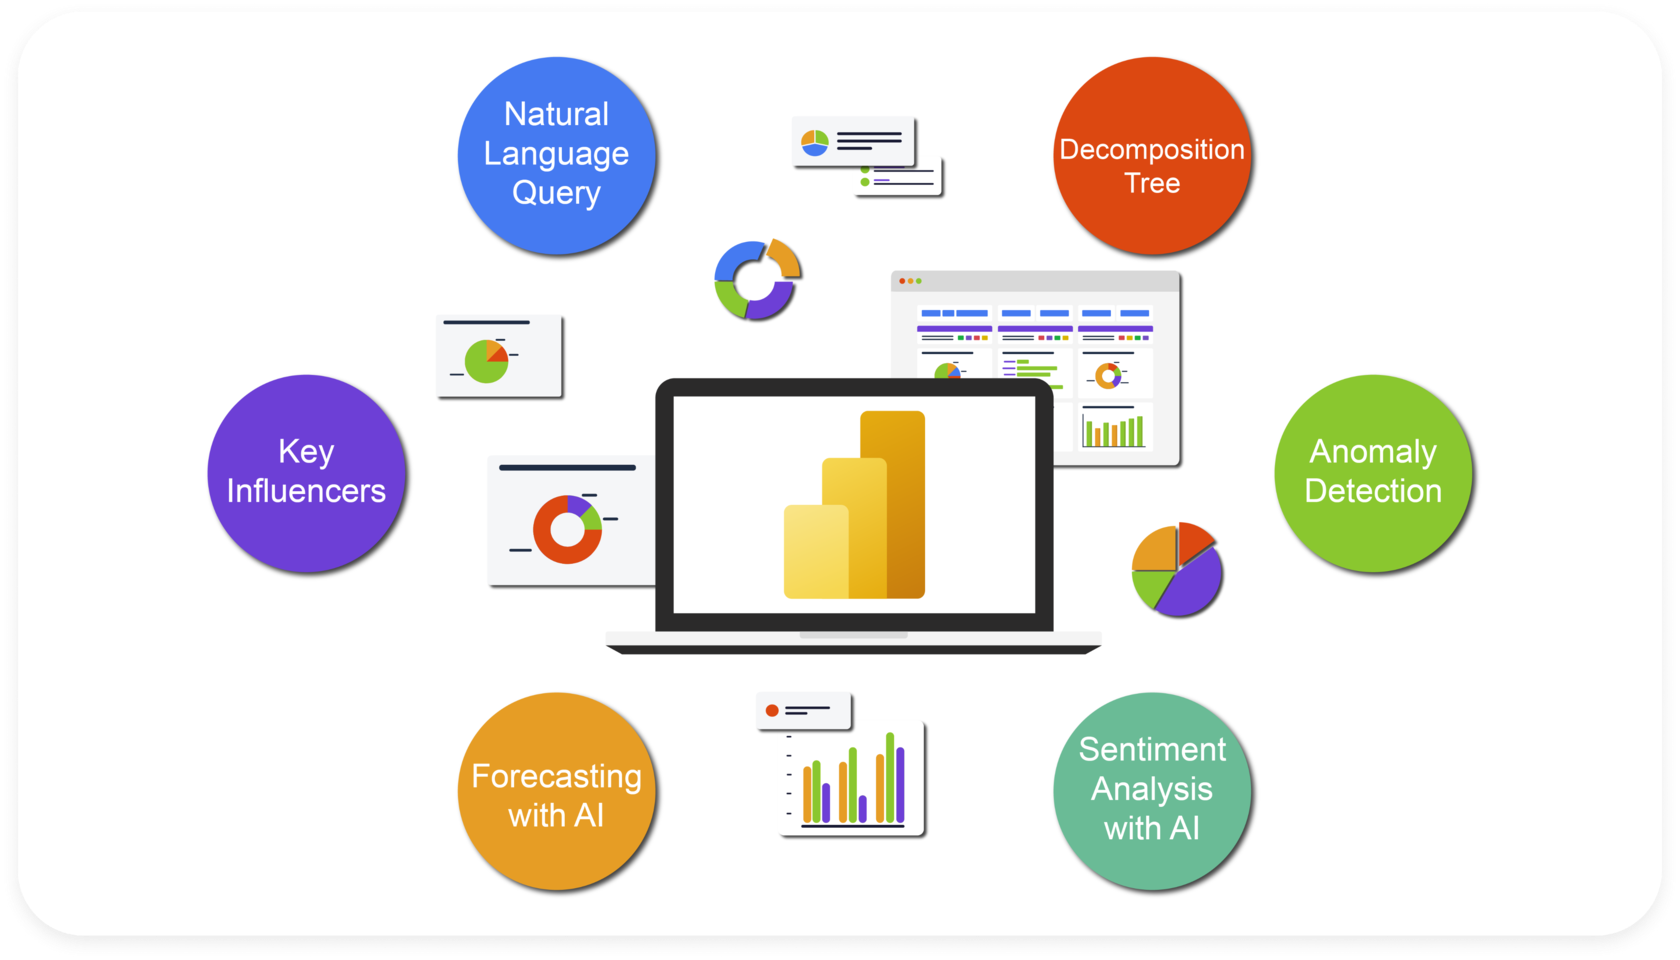
Key AI Features in Power BI
Now, let’s dive into the specific AI features Power BI offers and understand how they can be leveraged for smarter data insights.
Quick Insights
Quick Insights is one of the most powerful and time-saving AI features in Power BI. When you connect to a dataset, Power BI automatically analyzes it and presents you with a set of insights in the form of visualizations and descriptions. These insights highlight interesting patterns, correlations, and outliers that might not be immediately apparent.For example, Quick Insights might identify that sales for a particular product peak during holiday seasons or that there is a strong correlation between marketing spend and website traffic. These automated insights provide a starting point for further analysis and help users uncover hidden gems within their data.
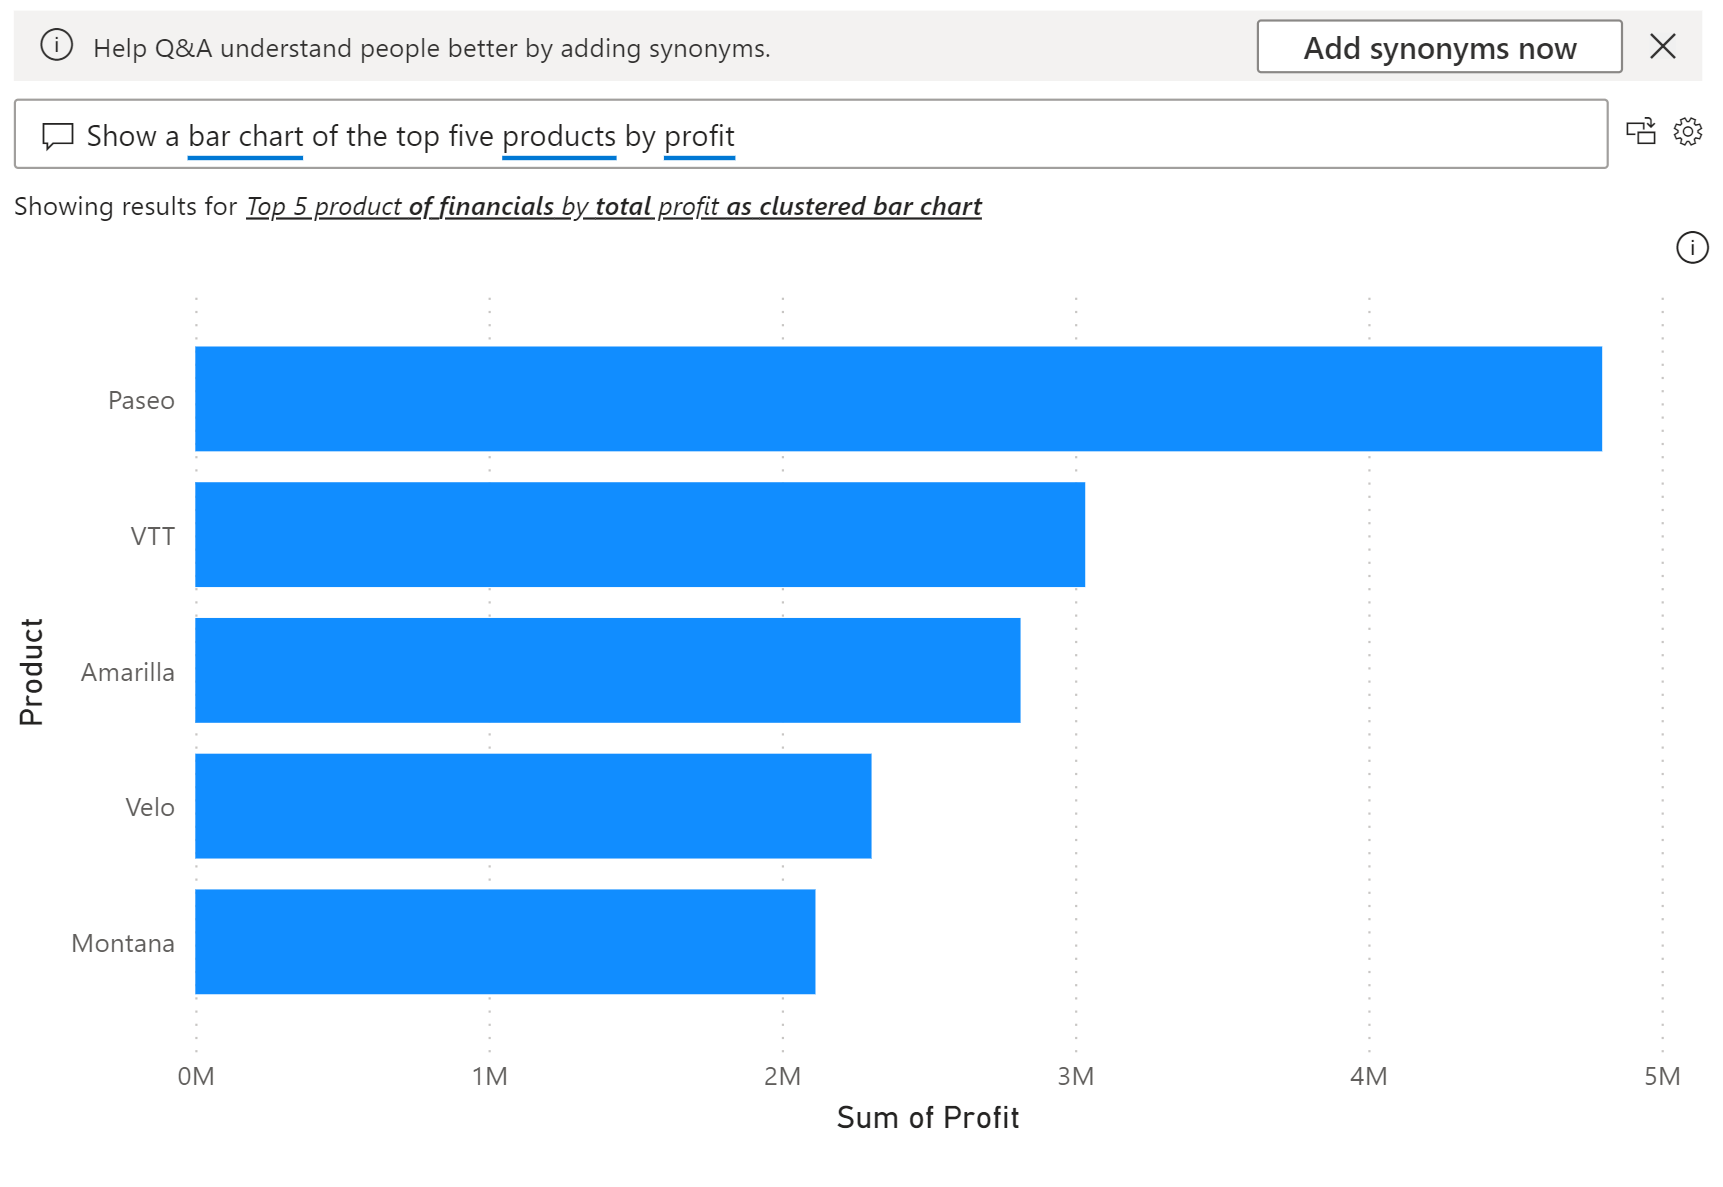
Q&A – Natural Language Interactions
The Q&A feature in Power BI allows users to ask questions about their data using natural language. Instead of creating complex queries or manually building visualizations, users can simply type or speak their questions, and Power BI will respond with relevant charts and answers.For instance, a user could ask, “What were our total sales for Q4 last year?” or “Show me the breakdown of expenses by category for the current month.” Power BI’s natural language processing understands the intent of the question and presents the requested information in a user-friendly manner.The Q&A feature is particularly useful for non-technical users who might not be familiar with building complex reports. It also saves time for experienced users who can quickly get answers to ad-hoc questions.
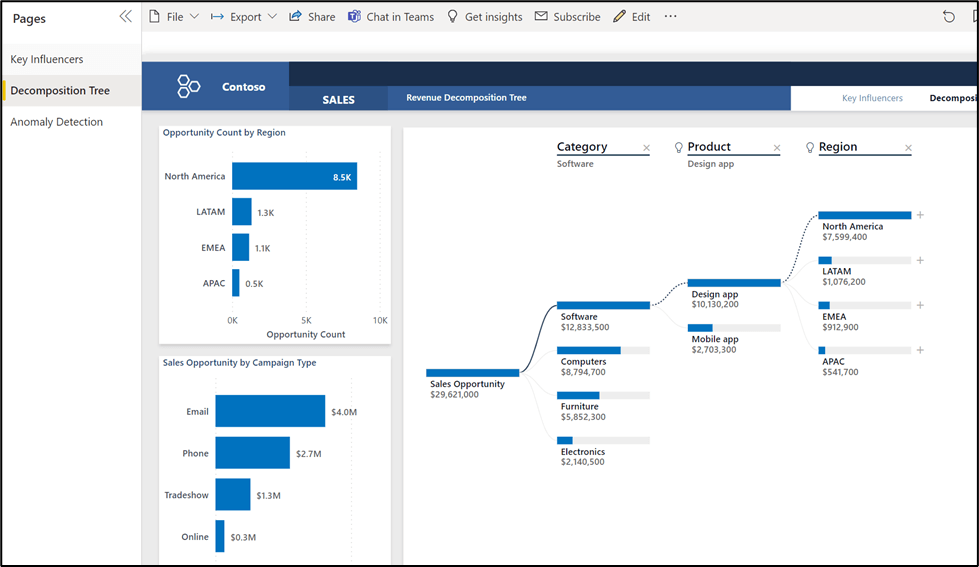
AI Visuals
Power BI offers a range of AI-powered visuals that provide advanced analytical capabilities. These visuals leverage machine learning to uncover complex patterns and relationships within data.One notable example is the Key Influencers visual, which identifies the primary drivers behind a specific metric. For instance, if you’re analyzing sales data, the Key Influencers visual might reveal that promotional discounts and customer location are the top factors influencing purchase decisions.Another useful AI visual is the Decomposition Tree, which helps users explore data hierarchies and understand the factors contributing to a particular metric. This visual is particularly valuable for root cause analysis and identifying areas for improvement.
Smart Narratives
Smart Narratives is a unique feature that generates automated narratives based on your data. These narratives read like human-written reports, providing a concise summary of the insights and trends identified. The narratives are dynamic and update as your data changes, ensuring you always have an up-to-date overview of your data story.For example, a Smart Narrative for sales data might state, “Our sales performance this quarter was strong, with a 15% increase year-over-year. This growth was primarily driven by increased demand in the North American market, particularly for our flagship product line.”Smart Narratives are highly customizable, allowing users to define the tone, language, and level of detail presented. They are a powerful way to communicate data insights to stakeholders and provide context alongside visualizations.
Forecasting and Anomaly Detection
Power BI’s AI capabilities also extend to forecasting and anomaly detection. The platform can analyze historical data and provide accurate forecasts, helping businesses make informed decisions about the future.The anomaly detection feature identifies unusual data points that deviate from the expected pattern. This is particularly useful for identifying potential issues or opportunities that might be hidden in large datasets.For instance, an e-commerce company might use anomaly detection to identify sudden spikes in website traffic, indicating a successful marketing campaign or an emerging issue with their platform.
Benefits of AI in Power BI
The integration of AI within Power BI brings numerous advantages to data analysis and business intelligence:
- Time Savings: AI automates tedious tasks such as data exploration, pattern recognition, and report generation, saving valuable time for data analysts and business users.
- Enhanced Insights: Machine learning algorithms can uncover complex relationships and patterns that might be difficult for humans to identify, leading to deeper and more accurate insights.
- Democratization of Data: Natural language interactions and automated visuals make data analysis more accessible to non-technical users, empowering more people within an organization to leverage data effectively.
- Improved Decision Making: By providing accurate forecasts and identifying anomalies, AI helps businesses make more informed decisions, reducing risks and optimizing strategies.
- Dynamic Reporting: AI-powered visuals and narratives ensure that reports are always up-to-date, reflecting the latest data and providing a more engaging experience for stakeholders.
Best Practices and Considerations
While Power BI’s AI features offer tremendous value, there are some considerations and best practices to keep in mind:
- Data Quality: AI is only as good as the data it analyzes. Ensure your data is clean, consistent, and of high quality to get accurate insights.
- Ethical Considerations: Be mindful of potential biases in data and algorithms. Regularly review and audit your AI models to ensure fairness and transparency.
- User Training: Provide adequate training and support to users, especially when introducing new AI features. This ensures users understand the capabilities and limitations of the tools and can leverage them effectively.
- Complementary Analysis: While AI automates many tasks, it should complement rather than replace human analysis. Always validate and interpret AI insights alongside human expertise.
- Visual Design: When using AI visuals, ensure they are intuitive and easy to understand. Provide clear explanations and context to help users interpret the insights effectively.
Real-World Use Cases
Here are some real-world examples of how organizations are leveraging Power BI’s AI features to drive success:
- Retail: A large retail chain uses Quick Insights and forecasting to optimize inventory management and identify emerging sales trends, resulting in improved product availability and reduced costs.
- Healthcare: A healthcare provider uses Smart Narratives to generate patient summaries, providing doctors with quick overviews of patient histories and improving the efficiency of patient care.
- Finance: A banking institution utilizes anomaly detection to identify potential fraud or security breaches, ensuring the safety of customer data and transactions.
- Marketing: A digital marketing agency uses Key Influencers visuals to analyze campaign performance, identifying the factors driving conversions and optimizing future campaigns accordingly.
- Manufacturing: A manufacturing company employs Power BI’s AI capabilities to forecast demand and optimize production planning, reducing waste and improving operational efficiency.
Conclusion and Future Outlook
Power BI’s AI features are transforming the way businesses interact with data, providing valuable insights and saving time. The capabilities explored in this article, including Quick Insights, natural language interactions, AI visuals, and more, empower organizations to make data-driven decisions with confidence.As we look to the future, it’s clear that the integration of AI and business intelligence will only become more sophisticated. We can expect to see continued advancements in natural language processing, making data interactions even more human-like and intuitive. Additionally, the expansion of AI-powered visuals and automated insights will further enhance the speed and accuracy of data analysis.The potential for AI in Power BI is immense, and organizations that embrace these capabilities will be well-positioned to leverage their data for competitive advantage.Question for Reflection: How do you see AI continuing to shape the future of business intelligence? What potential benefits and challenges do you foresee as AI becomes more integrated into data analysis workflows?