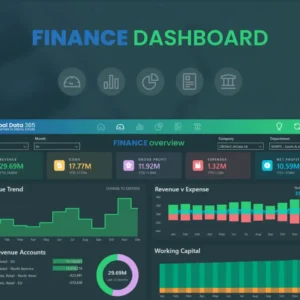
Welcome to our Power BI platform, the cutting-edge business intelligence and data visualization tool. In this article, we will explore the key features, benefits, and applications of Power BI, empowering you to harness the full potential of data analytics and make informed, data-driven decisions.
Overview of Business Intelligence:
Business Intelligence (BI) refers to the technologies, strategies, and practices used to collect, integrate, analyze, and present business data, transforming it into valuable insights. BI enables organizations to gain a holistic view of their operations, uncover patterns, and make data-driven decisions to drive growth and optimize performance. Power BI, developed by Microsoft, is one of the leading BI tools that provides an end-to-end solution for data analytics and visualization.
Understanding Power BI:
Power BI is a powerful and user-friendly platform that enables users to connect to various data sources, transform raw data into meaningful information, and create interactive dashboards and reports. It offers a wide range of data connectors, including popular databases, cloud services, and even Excel spreadsheets, allowing seamless integration and access to diverse data sets.
Key Features and Benefits:
- Data Visualization: Power BI offers a rich set of visualization options, including charts, graphs, maps, and tables, enabling users to present data in a visually appealing and easy-to-understand manner.
- Interactive Dashboards: With Power BI, you can create interactive dashboards that provide real-time insights into your business metrics. Users can drill down into specific data points, filter information, and perform ad-hoc analyses to gain deeper insights.
- Collaboration and Sharing: Power BI facilitates collaboration by allowing users to share dashboards and reports with colleagues, clients, or stakeholders. This promotes effective communication and enables everyone to work with the same accurate and up-to-date information.
- Data Transformation and Modeling: Power BI provides a range of data transformation and modeling capabilities, allowing users to clean and shape data to meet their analysis needs. Users can create calculated columns, measures, and relationships between tables for more advanced analysis.
- Integration with Microsoft Ecosystem: Power BI seamlessly integrates with other Microsoft tools such as Excel, Azure, and SharePoint, enhancing the overall data analytics capabilities and facilitating data flow across different platforms.
Applications of Power BI:
Power BI finds applications across various industries and functions, including sales and marketing, finance, operations, and human resources. It can be used for financial reporting, sales analysis, customer segmentation, inventory management, and much more. Power BI’s flexibility and scalability make it suitable for businesses of all sizes, from startups to large enterprises.
Conclusion:
Power BI is a game-changing tool for organizations looking to leverage their data for strategic decision-making and business growth. With its powerful analytics and data visualization capabilities, intuitive interface, and collaboration features, Power BI empowers users to uncover valuable insights and drive innovation in the digital age. Start your Power BI journey today and harness the power of your data to fuel your organization’s success.


