Table of Contents
ToggleIf you live in spreadsheets, Excel feels like home—instant calculations, quick charts, and easy what-ifs. But as your data grows, stakeholders multiply, and refresh cycles accelerate, you need a platform designed for analytics at scale. That’s where Power BI comes in: a modern BI layer for modeling, visualizing, securing, and governing data—built for sharing insights, not passing files.
Both tools are part of the Microsoft ecosystem and even share components like Power Query. Choosing isn’t about “which is better overall,” but “which is right for this job.” The answer depends on data size, refresh frequency, audience, and governance needs.
This article breaks down the differences that matter in real projects so you can choose confidently—and often, use both together for the best outcome.
Talk with an expert: info@powerbigate.com • +1-281-631-3767 • Book a Google Meet: https://calendly.com/bilalahmad3/30min
Excel vs. Power BI: A Quick Primer
Excel is a spreadsheet for calculations and flexible modeling. It’s unbeatable for free-form analysis, quick pivots, budgeting templates, and scenario modeling. You can build great reports, but maintaining version control and performance across teams can get messy.
Power BI is an analytics platform. It emphasizes data models, reusable measures, and interactive dashboards delivered through workspaces, apps, and the Power BI Service. Security, refresh scheduling, certified datasets, and row-level security come standard. It’s designed for many viewers, not just one analyst.
Bottom line: use Excel for “crafting” numbers fast; use Power BI for “serving” insights reliably.
Core Architecture Differences
Storage engine: Power BI’s VertiPaq columnar engine compresses data aggressively and queries it in memory, yielding fast aggregations over large tables. Excel stores values in cells and optional data models; it’s not optimized for enterprise-scale aggregations unless you lean on the Excel Data Model—which still trails Power BI’s service-level capabilities.
Data model: Power BI encourages a star schema with clear fact and dimension tables. Relationships, cardinality, and filter direction are first-class design choices. Excel can host a similar model via Power Pivot, but most analysts still operate on sheets, ranges, and tables—more flexible, less governed.
Semantic layer: In Power BI, consistent, reusable measures (DAX) live in the model. In Excel, logic often spreads across tabs, named ranges, and repeated formulas, which increases maintenance risk.
Formulas vs. DAX: How You Think Changes What You Build
Excel formulas (SUMIFS, XLOOKUP, INDEX/MATCH, LET, LAMBDA) excel at cell-level operations and quick logic. They’re intuitive but can be duplicated and drift over time.
DAX measures compute results contextually based on filters (e.g., slicers, row context, evaluation context). This makes one measure reusable everywhere—by product, region, month—without copy-pasting formulas. The result is fewer logic copies and more consistency across visuals and reports.
Rule of thumb: if the same metric is needed in many views, DAX centralizes logic better than cell formulas.
ETL and Data Prep: Power Query in Both Worlds
Power Query (M) ships with both Excel and Power BI. It’s your friend for:
-
Connecting to files, folders, databases, and APIs
-
Cleaning, reshaping, merging, and appending tables
-
Documenting transformation steps reproducibly
In Excel, Power Query feeds tables or the Data Model. In Power BI, it feeds the dataset for the report and service. The transformation experience is similar; the operationalization (scheduled refresh, gateway connections, lineage) is stronger in Power BI Service.
Data Volume, Speed, and Performance
As datasets grow, Excel bogs down—especially with complex array formulas, volatile calcs, and numerous tabs. Power BI’s compressed, in-memory model handles millions of rows comfortably and remains responsive when visuals filter across dimensions.
-
Chart 1: Suitability by Complexity—Excel shines for ad-hoc and small reporting; Power BI dominates dashboards, self-service BI, and enterprise analytics. Download PNG
-
Chart 2: Typical Data Volume Comfort Zone—Excel ≈ up to ~1M rows in practical terms; Power BI Import ≈ tens of millions; Power BI DirectQuery/Composite models can reach hundreds of millions with proper modeling. Download PNG
Performance levers in Power BI: star schema, proper cardinality, summarized tables, incremental refresh, aggregations, and Composite models. In Excel: reduce volatile functions, leverage the Data Model, and push heavy calculations into Power Query.
Collaboration, Governance, and Security
Version control: In Excel, teams often trade files by email or shared drives, which introduces “v23-final-final.xlsx” chaos. Power BI centralizes models and reports; everyone consumes the same live artifact.
Row-Level Security (RLS): Built-in for Power BI datasets, enabling user-specific views (e.g., a regional manager only sees their territory). In Excel, RLS is not native without external systems.
Lineage and certification: Power BI shows data lineage from source to report and supports certified datasets. Excel has no comparable, centralized lineage view.
Distribution: Power BI Apps deliver curated content packages to groups. Excel users rely on OneDrive/SharePoint links or email attachments.
Auditing: Power BI Service logs usage, dataset refreshes, and sharing activities. Excel auditing is manual or depends on external tools.
Cost and Licensing Considerations
Excel comes with Microsoft 365 and has no extra viewer costs. It’s cost-effective for single-user analysis and small teams.
Power BI introduces licenses (Free, Pro, Premium per user, Premium capacity). Pro is common for creators and consumers in small-to-mid teams; Premium is for enterprise scale, larger audiences, and advanced features like Paginated Reports and larger datasets.
Rule of thumb: If your audience is >10 recurring stakeholders consuming interactive dashboards weekly, Power BI Pro often pays for itself in reduced maintenance and improved reliability.
When to Use Excel vs. Power BI (with Scenarios)
Use Excel when…
-
You need a quick what-if model or a one-time analysis for a small audience.
-
Your source is a single CSV or a small table with simple calculations.
-
You need custom modeling flexibility (budgeting templates, goal-seek, Solver).
Use Power BI when… -
Data is large, refreshes regularly, or comes from multiple systems.
-
Many stakeholders need interactive filtering and consistent metrics.
-
You require RLS, scheduled refresh, certified datasets, and governance.
Scenario A: Finance month-end KPIs -
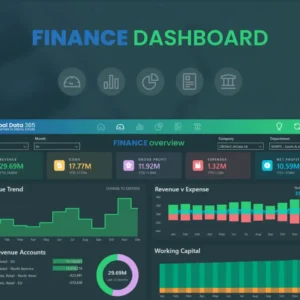
Raw exports from ERP + CRM; recurring stakeholders; consistent metrics. → Build a Power BI dataset with measures (Gross Margin %, CAC, AR Aging buckets). Publish a dashboard for executives and detailed pages for analysts. Maintain a small Excel template for ad-hoc checks if needed.
Scenario B: Board deck prep -
You want static slides with a few custom tables. → Excel may be faster. For ongoing KPI tracking, embed Power BI visuals or export data snapshots from the model.
Scenario C: Store performance by region -
Different managers should only see their territory. → Power BI with RLS and a shared app.
Migration Path: From Excel Reporting to Power BI
Inventory reports: List recurring Excel reports used by leadership or clients. Note owners, refresh cadence, data sources, and pain points (file size, manual steps).
Model the data: Design a star schema. Identify fact tables (transactions, ledger entries) and dimensions (date, product, customer, region).
Centralize transformations: Move merges, appends, and cleansing to Power Query in Power BI. Parameterize paths, credentials, and filters.
Define measures: Translate repeated Excel logic (e.g., “Net Revenue”, “Active Customers”, “Churn %”) into DAX measures. Keep names business-friendly.
Optimize performance: Use incremental refresh for large fact tables, summarize where possible, and create Aggregations for common query grains.
Secure and govern: Set up RLS roles, workspaces, and a certification process. Use deployment pipelines (Dev → Test → Prod) for safe releases.
Enable self-service: Publish a semantic model (dataset) and teach analysts to connect with Power BI or Excel’s “Analyze in Excel” for pivots over the shared model.
Measure adoption: Track usage metrics, refresh health, and user feedback. Iterate on UX: navigation, tooltips, bookmarks, and mobile layouts.
FAQs
Is Power BI just Excel with prettier charts? No. It’s a governed, semantic analytics platform with an in-memory engine, reusable measures, security, and distribution features.
Do I need DAX if I’m great at Excel formulas? For scalable reports, yes. DAX encodes metrics centrally so they’re reusable in any context without duplicating formulas.
Can I keep Excel in my workflow? Absolutely. Many teams build models in Excel, then publish the finalized metrics through a Power BI dataset and dashboard.
What about refresh schedules? Power BI Service supports scheduled refresh with gateways for on-prem sources; Excel requires more manual orchestration unless connected to the same dataset.
How big can my data get? Power BI comfortably handles tens of millions of rows in Import mode and much more via DirectQuery/Composite models, assuming good modeling and source performance.
Can non-technical users use Power BI? Yes. Consumers interact via slicers, drill-downs, and apps. Creators need some modeling/DAX skills, but viewers do not.
Summary
Excel and Power BI are complementary. Excel wins for agility and quick modeling. Power BI wins for shared, secure, and scalable analytics. As your organization matures, anchor key metrics in a Power BI dataset with proper governance and let Excel play to its strengths for exploration and bespoke modeling. This hybrid approach maximizes speed today and resilience tomorrow.
Feature-by-Feature Comparison Table
| Area | Excel | Power BI |
|---|---|---|
| Primary Strength | Ad-hoc analysis, modeling, quick calculations | Interactive dashboards, governed datasets, scalable analytics |
| Data Engine | Cell grid; optional Excel Data Model | VertiPaq columnar in-memory (Import), DirectQuery/Composite |
| Logic | Cell formulas (SUMIFS/XLOOKUP/LET/LAMBDA) | DAX measures and calculated columns (semantic layer) |
| Data Prep | Power Query available | Power Query native + service pipelines |
| Scalability | Practical limit ~hundreds of MB files; sluggish with many tabs | Tens of millions of rows (Import); enterprise via DirectQuery/Composite |
| Governance | Manual naming/versioning | Workspaces, apps, certified datasets, lineage, RLS |
| Collaboration | Email/SharePoint/OneDrive links | Power BI Service/App distribution; usage metrics |
| Security | File/password level | RLS, workspace roles, tenant admin controls |
| Refresh | Manual or via connections/macros | Scheduled refresh, gateways, incremental refresh |
| Cost | Included in M365 | Pro/Premium licensing for creators/consumers |
| Best Use | What-ifs, budgets, small reports | KPIs, self-service BI, exec dashboards |
Final Call-to-Action
Want help choosing the right mix—or migrating Excel reports into governed, executive-ready Power BI dashboards? Email info@powerbigate.com, call +1-281-631-3767, or book a Google Meet: https://calendly.com/bilalahmad3/30min


