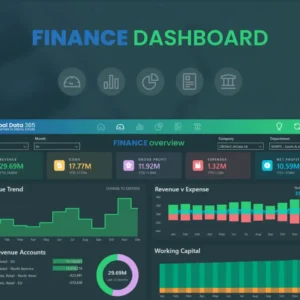
How to Build a CFO Executive Dashboard in Power BI
Complete guide with free template, best practices, and essential KPIs for executive financial reporting
A CFO Executive Dashboard in Power BI is a critical tool that provides C-suite executives with real-time insights into an organization's financial health. This comprehensive guide will walk you through creating a professional, data-driven dashboard that transforms raw financial data into actionable intelligence.
CFO dashboards serve as the central command center for financial decision-making, combining key performance indicators, trend analysis, and predictive metrics in a visually compelling format. Unlike traditional reporting methods, modern executive dashboards in Power BI offer interactive capabilities that allow CFOs to drill down into specific areas of concern or opportunity.
Building an effective CFO dashboard requires understanding both the technical aspects of Power BI and the strategic financial metrics that drive business decisions. This guide provides you with both, plus a free template to jumpstart your dashboard development process.
Need Expert Help with Your CFO Dashboard?
Our Power BI specialists can help you build a custom CFO dashboard tailored to your organization's specific needs. Get professional guidance and accelerate your business intelligence journey.
🎁 Free CFO Executive Dashboard Template
Download our professionally designed CFO dashboard template for Power BI. Includes all essential KPIs, visualizations, and best-practice layouts.
Download Free TemplateEssential KPIs for CFO Executive Dashboards
The foundation of any effective CFO dashboard lies in selecting the right key performance indicators. These metrics should provide a comprehensive view of financial performance while remaining focused on actionable insights.
| KPI Category | Key Metrics | Frequency | Target Audience |
|---|---|---|---|
| Revenue Performance | Total Revenue, Revenue Growth, Recurring Revenue | Monthly | CEO, CFO, Sales |
| Profitability | Gross Margin, EBITDA, Net Profit Margin | Monthly | Executive Team |
| Cash Flow | Operating Cash Flow, Free Cash Flow, Cash Position | Weekly | CFO, Treasury |
| Operational Efficiency | Working Capital, Inventory Turnover, DSO | Monthly | Operations, Finance |
| Financial Health | Debt-to-Equity, Current Ratio, ROI | Quarterly | Board, Investors |
Revenue and Growth Metrics
Revenue tracking forms the backbone of executive reporting. Your CFO dashboard should include both current period performance and trend analysis to identify growth patterns and potential concerns.
Profitability Analysis
Profitability metrics help executives understand not just how much revenue is being generated, but how efficiently the organization converts that revenue into profit.
Dashboard Design Principles for Executives
Executive dashboards require a different approach than operational reports. CFOs and other C-suite executives need information that is immediately actionable and presented in a format that supports quick decision-making.
Key Design Principles:
- Hierarchy of Information: Most critical KPIs should be prominently displayed
- Visual Consistency: Use consistent colors, fonts, and chart types
- Mobile Responsiveness: Ensure dashboard works on tablets and mobile devices
- Drill-Down Capability: Allow users to explore underlying data
- Real-Time Updates: Implement automated data refresh schedules
Layout and Visual Hierarchy
The most effective CFO dashboards follow the "5-second rule" - executives should be able to understand the current financial status within 5 seconds of viewing the dashboard.
Top Section
High-level KPI cards showing current month/quarter performance vs targets
Middle Section
Trend charts and comparative analysis showing performance over time
Bottom Section
Detailed breakdowns and supporting metrics for deeper analysis
Color Psychology in Financial Dashboards
Color choices significantly impact how executives interpret dashboard information. Use colors strategically to guide attention and convey meaning:
- Green: Positive performance, targets met or exceeded
- Red: Areas requiring immediate attention or below-target performance
- Blue: Neutral information, trends, and comparative data
- Orange/Yellow: Warning indicators, approaching thresholds
Step-by-Step CFO Dashboard Build Process
Building a CFO executive dashboard in Power BI involves several critical phases, from data preparation to final deployment. This systematic approach ensures your dashboard delivers maximum value to executive stakeholders.
Phase 1: Requirements Gathering and Planning
Before opening Power BI, invest time in understanding what your CFO and executive team actually need from the dashboard.
- Stakeholder Interviews: Meet with the CFO and key finance team members
- Current State Analysis: Review existing reports and identify pain points
- Success Metrics Definition: Establish what "success" looks like for the dashboard
- Technical Requirements: Identify data sources, refresh schedules, and access needs
Phase 2: Data Source Integration
CFO dashboards typically pull data from multiple sources. Proper integration is crucial for accuracy and reliability.
| Data Source Type | Common Systems | Connection Method | Refresh Frequency |
|---|---|---|---|
| Financial Systems | SAP, Oracle, QuickBooks | Direct Connect / API | Daily |
| CRM Data | Salesforce, HubSpot | Cloud Connector | Hourly |
| HR Systems | Workday, ADP | API / Export | Weekly |
| External Data | Market Data, Benchmarks | Web Services | Monthly |
Phase 3: Data Modeling and Relationships
Proper data modeling is the foundation of a reliable CFO dashboard. Focus on creating a star schema that supports efficient querying and accurate calculations.
Essential Tables for CFO Dashboards:
- Fact Tables: Financial transactions, sales data, expense records
- Dimension Tables: Time periods, organizational hierarchy, account codes
- Budget/Target Tables: Planned vs actual comparisons
- Exchange Rate Tables: For multi-currency reporting
Phase 4: DAX Calculations for Financial Metrics
Advanced financial calculations require sophisticated DAX formulas. Here are essential calculations for CFO dashboards:
Key DAX Formulas for CFO Dashboards:
- Year-to-Date Revenue: TOTALYTD(SUM(Sales[Revenue]), Calendar[Date])
- Prior Year Comparison: SAMEPERIODLASTYEAR(SUM(Sales[Revenue]))
- Rolling 12-Month Average: AVERAGEX(DATESINPERIOD(Calendar[Date], MAX(Calendar[Date]), -12, MONTH), [Monthly Revenue])
- Cash Flow Forecast: [Current Cash] + [Projected Inflows] - [Projected Outflows]
Advanced Power BI Features for CFO Dashboards
Modern CFO dashboards leverage advanced Power BI capabilities to provide deeper insights and enhanced user experience. These features transform static reports into dynamic, interactive analytical tools.
Conditional Formatting and Visual Alerts
Implement intelligent visual cues that automatically highlight areas requiring executive attention. This reduces the time CFOs spend scanning for issues and ensures critical problems are immediately visible.
Performance Indicators
Use traffic light colors for KPI cards based on performance thresholds
Variance Analysis
Automatically highlight significant deviations from budget or forecast
Trend Arrows
Show directional indicators for key metrics compared to previous periods
Data Bars
Visualize performance ranges directly within table cells
Drill-Through and Cross-Filtering
Enable executives to investigate anomalies without leaving the dashboard environment. Proper drill-through functionality allows CFOs to move from high-level summaries to detailed analysis seamlessly.
Implementation Best Practices:
- Create dedicated detail pages for each major KPI category
- Implement consistent navigation patterns across all drill-through pages
- Use breadcrumb navigation to help users understand their current location
- Ensure drill-through pages maintain executive-level focus
Dynamic Time Intelligence
CFO dashboards must support multiple time perspectives simultaneously. Implement dynamic time selection that allows executives to switch between different time horizons quickly.
Mobile Optimization for Executive Access
CFOs require access to critical financial information regardless of location. Mobile optimization ensures your dashboard delivers value whether executives are in the boardroom or traveling internationally.
Mobile-First Design Considerations
Design your dashboard with mobile constraints in mind from the beginning, rather than adapting desktop layouts for smaller screens.
| Design Element | Desktop Approach | Mobile Optimization |
|---|---|---|
| KPI Cards | 4-6 cards per row | 1-2 cards per row, larger text |
| Charts | Complex multi-series charts | Simplified, single-focus visualizations |
| Tables | Wide tables with many columns | Key columns only, horizontal scrolling |
| Navigation | Sidebar or tab navigation | Bottom navigation or hamburger menu |
Power BI Mobile App Integration
Leverage Power BI Mobile app features to enhance the executive experience:
- Phone Layout: Create dedicated mobile layouts for key dashboard pages
- Alerts: Set up data-driven alerts for critical threshold breaches
- Annotations: Enable mobile annotations for collaborative decision-making
- Offline Access: Configure dashboard caching for offline viewing
Security and Governance Framework
CFO dashboards contain highly sensitive financial information requiring robust security measures and governance protocols. Implementing proper security ensures compliance and protects against unauthorized access.
Row-Level Security Implementation
Different executives may need access to different portions of financial data. Implement row-level security to ensure users only see data appropriate to their role and responsibilities.
RLS Best Practices for CFO Dashboards:
- Create role-based filters for different organizational levels
- Implement time-based access controls for sensitive historical data
- Use dynamic security based on user attributes
- Test security rules thoroughly before deployment
- Document all security configurations for audit purposes
Data Governance and Audit Trails
Maintain comprehensive audit trails and governance protocols to ensure data integrity and regulatory compliance.
Essential Governance Components:
- Data Lineage: Document all data sources and transformation processes
- Change Management: Implement approval workflows for dashboard modifications
- Access Logs: Monitor and log all dashboard access and usage
- Backup Procedures: Regular backups of dashboard configurations and data
Ready to Transform Your Financial Reporting?
Let our Power BI experts help you implement a world-class CFO dashboard that drives better decision-making and strategic planning. Schedule a consultation to discuss your specific requirements.
Performance Optimization for Executive Dashboards
CFO dashboards must load quickly and respond instantly to user interactions. Performance optimization ensures executives can access critical information without delays that could impact decision-making.
Data Model Optimization
The foundation of dashboard performance lies in efficient data modeling. Optimize your data model to support fast query execution and minimal memory usage.
| Optimization Technique | Implementation | Performance Impact | Difficulty Level |
|---|---|---|---|
| Column Store Optimization | Remove unnecessary columns, optimize data types | High | Easy |
| Aggregation Tables | Pre-calculate common summary metrics | Very High | Medium |
| Incremental Refresh | Update only changed data partitions | High | Medium |
| Query Folding | Push transformations to data source | Medium | Hard |
Visual Performance Optimization
Optimize individual visuals to ensure rapid loading and smooth interactions:
- Limit Data Points: Use appropriate aggregation levels for executive summaries
- Efficient DAX: Write optimized DAX formulas using variables and avoiding iterative functions
- Visual Selection: Choose appropriate chart types that render quickly
- Conditional Visibility: Hide detailed visuals until needed through bookmarks
Capacity Planning and Scaling
Plan for growth in data volume and user concurrency to ensure consistent performance as your organization scales.
Best Practices and Common Pitfalls
Learning from common mistakes and implementing proven best practices can significantly improve your CFO dashboard's effectiveness and user adoption.
Top 10 Best Practices
1. Start with Strategy
Align dashboard metrics with business strategy and executive priorities
2. Keep It Simple
Focus on essential KPIs rather than overwhelming with data
3. Ensure Data Quality
Implement robust data validation and quality checks
4. Design for Users
Prioritize user experience and intuitive navigation
5. Test Thoroughly
Validate calculations and test with real user scenarios
6. Document Everything
Maintain comprehensive documentation for maintenance and training
Common Pitfalls to Avoid
| Pitfall | Impact | Prevention Strategy |
|---|---|---|
| Information Overload | Reduced decision-making speed | Focus on top 5-7 KPIs per page |
| Poor Data Governance | Inaccurate decisions, compliance issues | Implement robust validation and audit trails |
| Ignoring Mobile Users | Limited accessibility, poor adoption | Design mobile-first approach |
| Static Design | Outdated insights, irrelevant metrics | Regular review and update cycles |
| Performance Issues | User frustration, abandonment | Optimize data model and refresh schedules |
Change Management and User Adoption
Technical excellence alone doesn't guarantee dashboard success. Implement proper change management to ensure high user adoption and maximum value realization.
User Adoption Strategies:
- Executive Sponsorship: Secure visible support from C-suite leadership
- Training Program: Develop role-specific training for different user groups
- Feedback Loops: Establish regular feedback collection and implementation cycles
- Success Stories: Share examples of decisions improved by dashboard insights
- Continuous Improvement: Regularly enhance dashboard based on user needs
Future Trends in CFO Dashboard Technology
The landscape of executive dashboards continues evolving rapidly. Understanding emerging trends helps ensure your CFO dashboard remains cutting-edge and delivers maximum value.
Artificial Intelligence Integration
AI-powered features are transforming how CFOs interact with financial data, moving from reactive reporting to proactive insights and predictive analytics.
Automated Insights
AI automatically identifies trends, anomalies, and opportunities in financial data
Natural Language Queries
Ask questions in plain English and receive instant analytical responses
Predictive Modeling
Machine learning models forecast future financial performance
Smart Recommendations
AI suggests actions based on pattern recognition and historical outcomes
Real-Time Data Streaming
Modern CFO dashboards increasingly leverage real-time data streams for immediate insights into financial performance and market conditions.
Enhanced Collaboration Features
Future dashboards will include advanced collaboration tools enabling distributed teams to work together more effectively on financial analysis and planning.
Conclusion: Building Dashboard Excellence
Creating an effective CFO Executive Dashboard in Power BI requires combining technical expertise with deep understanding of executive needs and financial business processes. The investment in building a high-quality dashboard pays dividends through improved decision-making, increased operational efficiency, and enhanced strategic planning capabilities.
Remember that dashboard development is an iterative process. Start with core functionality, gather user feedback, and continuously refine your approach. The most successful CFO dashboards evolve with organizational needs and incorporate emerging technologies to maintain their competitive advantage.
By following the guidelines, best practices, and technical approaches outlined in this guide, you'll be well-equipped to create a CFO dashboard that truly transforms how your organization approaches financial intelligence and executive reporting.
🚀 Get Started with Our Free Template
Download our comprehensive CFO Executive Dashboard template and accelerate your implementation. Includes sample data, advanced DAX formulas, and professional design elements.
Download Complete Template PackageRelated Articles & Resources
Essential Financial KPIs Every Power BI Dashboard Should Track
Comprehensive guide to the most important financial metrics for business intelligence dashboards.
Read Full Article →Power BI Security Best Practices for Enterprise
Complete security framework for protecting sensitive business data in Power BI environments.
Learn More →Advanced DAX Formulas for Financial Analysis
Master complex DAX calculations for sophisticated financial reporting and analysis.
Explore DAX →Power BI Mobile Optimization Guide
Ensure your dashboards deliver exceptional experience across all mobile devices and platforms.
Mobile Guide →Executive Dashboard Design Principles
Design frameworks and best practices for creating dashboards that executives actually use.
Design Guide →Power BI Performance Optimization
Technical strategies for building fast, scalable Power BI solutions for enterprise environments.
Optimize Performance →


