Natural language processing (NLP) has revolutionized the way we interact with data, and Power BI’s Q&A feature is a powerful example of this. In this article, we’ll delve into the world of natural language queries, discovering how to use Power BI’s Q&A effectively and unlock valuable insights from your data. By the end, you should feel empowered to ask questions of your data in a natural, conversational way and receive meaningful answers. So, let’s begin our exploration of this exciting feature!
Understanding Natural Language Queries and Q&A
Natural language queries are a way for users to interact with data by asking questions in plain English (or other languages) instead of using complex query languages or coding. Power BI’s Q&A feature enables users to do just that – ask questions about their data and receive answers in the form of visuals and insights. This intuitive approach enhances the user experience and makes data exploration more accessible.The Q&A feature in Power BI is driven by NLP and machine learning algorithms. It interprets the user’s question, analyzes the underlying data, and generates a response in the form of a visual, table, or textual answer. This feature aims to bridge the gap between users and their data, making it easier for non-technical users to extract value from their datasets.
Why Natural Language Queries Matter
Natural language queries and the Q&A feature offer several benefits:
- Accessibility: They lower the barrier to data analysis, allowing users without technical expertise to explore data.
- Efficiency: Users can ask questions and get answers instantly, streamlining the decision-making process.
- Insights: By asking questions, users can uncover insights they might not find through traditional reporting methods.
- User Engagement: Q&A encourages users to interact with data, fostering a culture of data exploration and curiosity.
- Natural Interaction: Natural language queries mimic everyday conversations, making data analysis more intuitive and enjoyable.
- Time Savings: Users can bypass the need to create custom reports or visualizations for every question, saving time and effort.
Enabling and Setting Up Q&A
To start using the Q&A feature in Power BI, you’ll need to ensure it’s enabled and properly set up. Here’s a step-by-step guide:
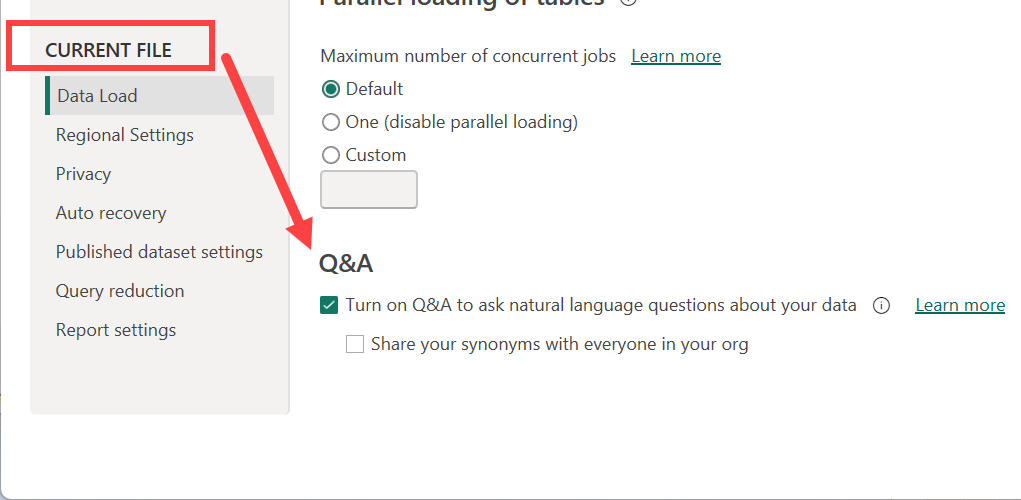
- Enable Q&A: In Power BI Desktop, go to the “File” menu, select “Options and settings,” and choose “Options.” In the options dialog, navigate to the “Preview features” section and ensure “Enable Q&A” is checked.
- Data Preparation: For Q&A to work effectively, ensure your data is clean, structured, and well-organized. Define relationships between tables and create meaningful column names that users can understand.
- Teach Q&A: Power BI’s Q&A is smart, but it needs some guidance. In the “Modeling” tab, select “Q&A” and then “Edit Q&A terms.” Here, you can teach Q&A synonyms and related terms for your data.
- Define Data Categories: Help Q&A understand your data by setting data categories. Right-click on columns and select “Set Data Category.” Choose the appropriate category, such as “Date,” “Geography,” or “Quantity.”
- Test and Refine: Use the “Ask a question about your data” box to test Q&A. As you ask questions, Power BI will suggest improvements and learn from your queries.
- Enable for Reports: When publishing reports to the Power BI service, ensure the “Enable Q&A for this report” option is checked. This allows consumers of your reports to use Q&A.
Asking Questions and Interpreting Answers
Now for the exciting part – asking questions and interpreting the answers! Here are some tips and examples to get the most out of Q&A:
- Ask Natural Questions: Formulate your queries as you would in a conversation. For example, “Show sales by region over time” or “What was our top-selling product last quarter?”
- Use Natural Language: Avoid technical jargon or complex syntax. Speak to Power BI as you would to a colleague.
- Explore Data: Ask open-ended questions to uncover insights. For instance, “What are our top 5 customers by lifetime value?”
- Drill Down: Refine your queries to focus on specific areas. For example, “Breakdown of sales by product category for the last month.”
- Compare Data: Q&A can handle comparative questions. Try asking, “Compare revenue and profit for Q1 and Q2.”
- Interpret Visuals: Pay attention to the visuals Q&A generates. These are designed to provide insights and answer your questions effectively.
- Refine Questions: If the initial answer isn’t what you expected, refine your question. Power BI will learn from your refinements.
- Use Filters: Include filters in your questions to narrow down results. For instance, “Show sales by region for Q3 2022.”
- Understand Context: Q&A considers the context of your data. Asking about “revenue” will be interpreted differently in financial and sales contexts.
- Explore Suggestions: As you type, Q&A provides suggestions. These are based on your data and can guide your exploration.
Enhancing Q&A with Customizations
While Power BI’s Q&A is smart out of the box, you can further enhance it with customizations:
- Teach Q&A More: In the “Edit Q&A terms” section, continue teaching Q&A synonyms and related terms. This improves its understanding of your data.
- Define Composite Models: For complex questions involving multiple data sources, define composite models to help Q&A understand relationships.
- Use Data Categories: Ensure all relevant data categories are set, especially for measures and dimensions.
- Create Custom Visuals: If Q&A doesn’t provide the exact visual you need, create custom visuals and teach Q&A to use them.
- Prompts and Hints: Guide users with prompts and hints. For example, “Ask me about sales trends” or “Try asking about customer demographics.”
- Data Modeling: A well-modeled dataset improves Q&A accuracy. Ensure tables, columns, and relationships are named and structured logically.
- Security and Privacy: Consider data security and privacy when enabling Q&A. Ensure sensitive data is protected and accessible only to authorized users.
- Data Quality: Accurate and complete data is crucial. Regularly review and clean your data to ensure Q&A provides reliable answers.
Best Practices and Tips for Effective Q&A
To get the most out of Power BI’s Q&A feature, consider the following best practices:
- Clear and Concise Questions: Formulate questions clearly and concisely. Avoid ambiguity, as it may lead to misinterpretation.
- Start Simple: Begin with basic questions and gradually increase complexity as you become more familiar with Q&A.
- Explore Suggestions: Take advantage of Q&A’s suggestions, as they’re based on your data and can guide your exploration effectively.
- Refine and Learn: Power BI learns from your refinements, so don’t be afraid to ask follow-up questions to narrow down results.
- Use Natural Language: Speak naturally, avoiding complex syntax. For example, “Show me the top 10 products by sales” instead of “Top N products by metric = sales.”
- Data Modeling Matters: Invest time in data modeling. Well-structured and named tables improve Q&A accuracy.
- Test Extensively: Regularly test Q&A with different user roles to ensure it understands a variety of question types.
- Provide Feedback: If Q&A doesn’t provide the expected answer, provide feedback by clicking the “Thumbs down” icon and refining the question.
- Combine with Other Visuals: Use Q&A alongside traditional visuals. It’s a complementary feature, enhancing your overall data exploration experience.
- Consider User Roles: Different users will ask different questions. Consider their roles and data needs when setting up and teaching Q&A.
Case Study: Using Q&A for Retail Sales Analysis
Let’s apply these concepts to a case study of a retail business using Power BI to analyze sales data. We’ll explore how Q&A can provide valuable insights to the business.
Background
Retail Analytics Co. is a retail business with stores across the country. They use Power BI to analyze sales data, track performance, and make data-driven decisions. With a large and diverse user base, they aim to make data exploration accessible to all employees.
Goals
- Enable users to ask questions about sales data and receive instant insights.
- Improve data literacy among employees by providing an intuitive data exploration tool.
- Identify trends and patterns in sales data that may not be apparent from standard reports.
- Enhance decision-making by providing a self-service data analysis tool.
- Save time and resources by reducing the need for custom reports.
Data Sources
- Sales Data: Includes store locations, product categories, sales figures, customer demographics, and promotional data.
- Customer Feedback: Data from customer surveys and reviews, providing insights into satisfaction, preferences, and shopping behavior.
- Market Research: Data on market trends, competitor performance, and industry benchmarks.
Q&A in Action
- Sales Performance: Users ask, “Show sales performance over time.” Q&A generates a line chart showing sales trends, with filters for date ranges and product categories.
- Insight: Users can quickly identify sales peaks and troughs, helping them plan promotions and inventory management.
- Top-Performing Products: The question “What are our top-selling products by region?” results in a map visual with a breakdown of top products by geography.
- Insight: Users can identify regional preferences and adjust inventory and marketing strategies accordingly.
- Customer Behavior: By asking, “How do customer ratings impact sales?” users receive a scatter plot showing the relationship between sales and customer satisfaction ratings.
- Insight: A positive correlation is identified, highlighting the importance of customer satisfaction to sales performance.
- Promotional Impact: The query “Breakdown of sales by promotion type” yields a bar chart showing the effectiveness of different promotions.
- Insight: Users can quickly assess the ROI of promotions and adjust their strategies to focus on the most successful types.
Outcomes
By implementing Power BI’s Q&A feature, Retail Analytics Co. achieves the following:
- Employees across the organization can now ask questions about sales data and receive instant insights, improving data literacy and decision-making.
- Users uncover hidden trends and patterns, such as the impact of customer satisfaction on sales, leading to improved strategies for customer engagement.
- The time and resources spent on creating custom reports are reduced, as users can now explore data independently.
- With Q&A, the business can react quickly to market changes, adjust strategies, and make data-driven decisions with confidence.
- Data exploration becomes enjoyable and intuitive, fostering a culture of curiosity and data-driven thinking throughout the organization.
Conclusion and Next Steps
In this article, we’ve explored the power of natural language queries and Power BI’s Q&A feature. You should now feel equipped to ask questions of your data and interpret the answers effectively. As you continue on your Power BI journey, here are some questions to consider:
- How can organizations encourage a culture of data exploration and curiosity through natural language queries?
- What strategies can be employed to ensure data security and privacy while enabling the Q&A feature for a wide range of users?
- In what ways can Q&A be combined with traditional reporting to provide a comprehensive data analysis experience?
- How might Q&A be used to identify unexpected insights or anomalies in large datasets?
- Are there any limitations or challenges to using natural language queries, and how can they be addressed?
I encourage you to share your thoughts, experiences, and insights in the comments below. Let’s continue the conversation and help each other unlock the full potential of Power BI’s Q&A feature!