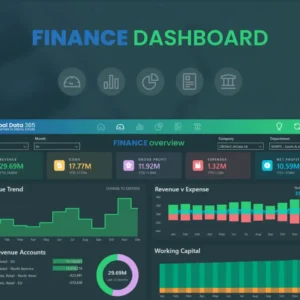
In today’s competitive landscape, businesses are increasingly pressured to make data-driven decisions that drive growth and profitability. One powerful tool in the data analysis arsenal is Power BI, a comprehensive business intelligence platform that transforms raw data into actionable insights. Among its many features, the forecasting capability stands out as a game-changer, enabling users to leverage predictive analytics and gain a competitive edge.
Forecasting in Power BI utilizes advanced statistical algorithms to analyze historical data and predict future trends. This functionality is invaluable for businesses seeking to anticipate market changes, optimize inventory levels, and allocate resources effectively. With Power BI’s user-friendly interface, users can easily implement forecasting features, making it accessible for both seasoned analysts and those new to the platform.
To optimize forecasting in Power BI, it’s crucial to start with clean, well-structured data. Ensuring that your dataset is free of errors and formatted correctly enhances the accuracy of your forecasts. Next, utilize the built-in forecasting tools to visualize trends and seasonality in your data. Power BI allows users to customize forecasting settings, including the confidence interval and the seasonality of the data, which can be tailored to meet specific business needs.
Moreover, integrating forecasting insights with other Power BI features—such as data visualization and dashboards—can provide a holistic view of your business performance. By visualizing forecasts alongside key performance indicators (KPIs), businesses can make more informed decisions based on comprehensive data analysis.
Whether you’re a seasoned Power BI user or just starting, mastering forecasting in Power BI can significantly enhance your strategic planning. By harnessing the full potential of this remarkable tool, organizations can drive smarter business decisions and maintain a competitive edge in today’s fast-paced market.
Understanding Power BI Forecasting
At its core, the forecasting feature in Power BI empowers users to generate accurate predictions based on historical data. By analyzing past trends and patterns, Power BI can extrapolate future values, allowing businesses to anticipate market changes, plan for contingencies, and make informed strategic decisions. This capability is essential in today’s fast-paced business environment, where organizations must remain agile and proactive to stay competitive.
The forecasting functionality in Power BI is powered by advanced statistical algorithms and machine learning models that are seamlessly integrated into the platform. This integration enables users to create reliable forecasts without needing complex data modeling or specialized data science expertise. As a result, Power BI democratizes data analytics, making sophisticated forecasting accessible to users at all skill levels.
Using Power BI’s forecasting tools, businesses can easily visualize trends over time. By simply selecting a time series chart, users can apply the forecasting feature to their data. Power BI will then automatically analyze the dataset and generate a forecast, which can be customized to fit the organization’s unique needs. Users can adjust parameters such as confidence intervals, seasonality, and the length of the forecast period, ensuring that the predictions align with their business context.
Moreover, Power BI allows users to visualize these forecasts alongside historical data, providing a clear and comprehensive picture of expected outcomes. This visual representation aids stakeholders in understanding potential future scenarios, facilitating better communication and collaboration across teams.
The forecasting feature in Power BI equips organizations with the tools they need to make data-driven decisions confidently. By leveraging historical data and advanced algorithms, businesses can enhance their strategic planning, minimize risks, and capitalize on emerging opportunities.
Preparing Your Data for Accurate Forecasting
Before diving into the forecasting process in Power BI, it’s crucial to ensure that your data is clean, organized, and ready for analysis. This foundational step significantly impacts the precision and reliability of the forecasts you generate. Below are some key considerations to keep in mind when preparing your data for effective forecasting.
Data Quality
The integrity of your data is paramount for accurate forecasting. Begin by ensuring that your dataset is free from errors, missing values, and inconsistencies. Poor data quality can lead to misleading forecasts, jeopardizing your organization’s decision-making process. Utilize Power BI’s data transformation and cleansing capabilities, such as Power Query, to systematically identify and eliminate any data quality issues. This process might include removing duplicates, correcting typographical errors, and filling in missing values through appropriate methods (e.g., interpolation or mean substitution). Investing time in data quality will ultimately pay dividends by enhancing the reliability of your forecasts.
Temporal Alignment
Another vital aspect of data preparation is ensuring temporal alignment. Verify that your data is structured to align with the time intervals you intend to forecast. This might involve setting up proper date and time columns and managing time zones effectively. Make sure that your data points correspond accurately to the desired time periods, whether daily, weekly, monthly, or yearly. Misaligned time intervals can lead to significant discrepancies in your forecasts. For instance, if you’re forecasting monthly sales, ensure that each data point represents a complete month of activity. Power BI’s time intelligence functions can aid in managing these temporal elements, allowing you to work with your data more effectively.
Seasonality and Trends
Identifying seasonal patterns and long-term trends in your data is crucial for accurate forecasting. Seasonal variations may stem from cyclical events, holidays, or changes in consumer behavior, while trends could reflect shifts in the market or industry over time. Power BI offers built-in time intelligence functions, such as SAMEPERIODLASTYEAR and DATEADD, which help in detecting these factors. By understanding the seasonal and trend components of your data, you can incorporate them into your forecasts, leading to more informed predictions. For example, if you notice a spike in sales during the holiday season, adjusting your forecasts to account for this seasonality can enhance their accuracy.
Outlier Detection
Outliers and anomalies in your data can skew forecasts and lead to inaccurate conclusions. Therefore, it’s essential to analyze your data for any irregularities that could impact forecasting. Power BI’s advanced analytics capabilities, including statistical functions and visualizations, can assist in identifying and handling these outliers. Techniques such as box plots and scatter plots can visually highlight data points that fall outside expected ranges. Once identified, decide how to address these outliers—whether to remove them, adjust their values, or keep them based on their relevance to the forecasting model. This careful examination ensures that your forecasts are not unduly influenced by exceptional data points, which may not reflect future trends.
By meticulously preparing your data, you set the stage for Power BI’s forecasting algorithms to perform at their best. This preparation includes ensuring data quality, aligning temporal structures, identifying seasonal trends, and detecting outliers. Each of these elements contributes to the overall reliability and accuracy of your forecasts. When your data is well-organized and insightful, Power BI can leverage its advanced predictive capabilities to deliver robust and actionable predictions. By investing time and effort in data preparation, you enhance your organization’s ability to make data-driven decisions that drive growth and operational efficiency. Ultimately, this foundational work allows you to unlock the full potential of forecasting in Power BI, equipping your organization with valuable insights for the future.
Configuring Forecasting in Power BI
With your data in order, you can now harness the power of Power BI’s forecasting capabilities. Here’s a step-by-step guide to configuring and customizing your forecasts effectively.
Selecting the Right Forecasting Model
Power BI offers a variety of forecasting models, each with distinct strengths and weaknesses. For most use cases, automatic forecasting based on the Prophet algorithm serves as an excellent starting point, as it simplifies the forecasting process by automatically detecting seasonality and trends in your data. However, depending on the unique characteristics of your dataset, you might also want to explore other models like ARIMA (AutoRegressive Integrated Moving Average) or Exponential Smoothing, which can provide more nuanced insights, especially for data with specific patterns or irregularities.
Setting Forecast Parameters
Once you’ve selected a model, you can customize various parameters that influence the forecasting process. Key parameters to consider include the forecast horizon, which defines the number of future time periods you want to predict; the confidence interval, representing the range of values within which actual future values are likely to fall; and seasonality, which accounts for recurring patterns in your data. By carefully adjusting these settings, you can fine-tune your forecasts to better reflect your organization’s needs.
Visualizing and Interpreting Forecasts
Power BI provides intuitive visualization tools that facilitate the interpretation of your forecasts. You can create line charts, area charts, or other visual representations to clearly communicate your predictions and identify potential trends or anomalies. These visualizations help stakeholders grasp the implications of the forecasts quickly and make informed decisions based on the data presented.
Evaluating Forecast Accuracy
Regularly assessing the accuracy of your forecasts is crucial for continuous improvement. Power BI offers several metrics, such as Mean Absolute Error (MAE) and Root Mean Square Error (RMSE), to gauge the reliability of your predictions. By tracking these metrics, you can identify areas for refinement and enhance the overall effectiveness of your forecasting process. Continuous evaluation allows for adjustments to forecasting models and parameters, ensuring that your organization can adapt to changing circumstances and maintain a competitive edge.
Optimizing Forecasting Accuracy
To further enhance the accuracy and reliability of your forecasts, consider the following strategies:
Incorporating External Data
One effective way to enrich your forecasting models is by integrating relevant external data sources. For instance, economic indicators, such as inflation rates or consumer confidence indexes, can provide context that enhances your forecasts. Similarly, weather patterns may impact sales in certain industries, such as retail or agriculture. Industry-specific factors, like market trends or competitor activity, can also significantly influence your business dynamics. By including these external variables, you can create a more robust forecasting model that captures the complex relationships affecting your organization, leading to more precise predictions.
Experimenting with Different Models
Don’t hesitate to explore alternative forecasting models and techniques available in Power BI. The platform’s flexibility enables you to try various approaches, such as ARIMA, Exponential Smoothing, or machine learning-based models, and compare their performance against your historical data. By conducting experiments, you can determine which model provides the most accurate and reliable forecasts for your specific use case. This iterative process of testing and learning can uncover valuable insights, helping you adapt your forecasting strategy to align with your unique business context.
Continuous Monitoring and Adjustment
Regularly reviewing your forecasts is crucial for maintaining their accuracy over time. As your business environment evolves, market conditions change, and new data becomes available, it’s essential to adjust your forecasting models accordingly. Keep an eye on the accuracy of your predictions and monitor key performance indicators, like Mean Absolute Error (MAE) and Root Mean Square Error (RMSE). Be prepared to fine-tune your parameters and incorporate new data sources to ensure that your forecasts remain relevant and precise. This commitment to continuous improvement will empower your organization to make informed, data-driven decisions and maintain a competitive edge in an ever-changing market landscape.
Leveraging Forecasting Insights
Once you’ve mastered the art of forecasting in Power BI, it’s time to harness the power of your insights to drive strategic decision-making. Here are some ways you can leverage your forecasts:
Informed Business Planning
Utilizing your forecasts effectively can greatly inform your budgeting, resource allocation, and long-term strategic planning. Accurate predictions allow you to anticipate future demands, which is crucial for optimizing inventory levels, workforce planning, and capital expenditures. By aligning your resource allocation with expected market conditions, you can minimize waste, maximize efficiency, and ensure that your organization is well-prepared for upcoming challenges. This proactive approach to planning enables your business to operate more smoothly and reduces the risk of overextending resources or facing shortages.
Risk Mitigation
Forecasting is also an essential tool for risk mitigation. By analyzing trends and potential scenarios, you can identify possible risks that may impact your business operations. This foresight allows you to develop proactive contingency plans tailored to different situations, such as market fluctuations or economic downturns. For example, if your forecasts indicate a potential decline in demand, you can take preemptive measures to adjust your inventory levels or reallocate resources. Strengthening your organization’s resilience through well-informed planning ensures that you can adapt quickly to unforeseen circumstances, protecting your bottom line and maintaining operational continuity.
Competitive Advantage
Harnessing the power of predictive analytics can give your organization a significant competitive edge. Accurate forecasts can provide valuable insights into industry trends, customer preferences, and emerging opportunities, allowing you to make strategic moves ahead of the competition. By understanding shifts in the market and anticipating consumer behavior, you can tailor your products, marketing strategies, and overall business approach to better meet customer needs. This agility enables your organization to capitalize on opportunities before others do, positioning you as a leader in your industry and enhancing your long-term success.
In summary, integrating forecasting into your business processes can empower your organization to make more informed decisions, mitigate risks, and stay ahead of the competition.
Conclusion
Forecasting in Power BI is a powerful tool that can significantly transform how your organization approaches data-driven decision-making. By mastering the art of optimizing forecasting accuracy, you unlock a wealth of opportunities for growth, risk mitigation, and competitive advantage. Effective forecasting allows businesses to anticipate market shifts, align resources strategically, and make informed decisions that drive success.
To achieve optimal forecasting accuracy in Power BI, it is essential to start with clean, well-structured data. The quality of your historical data directly impacts the reliability of your forecasts. Ensure that your datasets are free from errors and inconsistencies, as this foundation is crucial for generating trustworthy predictions. Additionally, leveraging Power BI’s built-in tools to visualize data trends and seasonality will enhance your understanding of underlying patterns, allowing for more precise forecasting.
Furthermore, take advantage of Power BI’s customization options. Users can adjust parameters such as confidence intervals and seasonality settings to tailor forecasts to their specific business context. Regularly reviewing and refining these parameters based on new data and evolving market conditions will help maintain the accuracy of your forecasts.
It’s also important to foster a culture of collaboration within your organization. Involve stakeholders from various departments in the forecasting process to ensure that insights are well-rounded and reflective of different perspectives. Their input can enhance the accuracy of your forecasts and improve buy-in across the organization.
Remember, the journey of perfecting forecasting in Power BI is ongoing. Embrace a mindset of continuous learning, experimentation, and refinement. Stay updated on the latest features and advancements in Power BI, and be open to integrating new methodologies and tools. This proactive approach will ensure that your insights remain relevant and valuable in the ever-evolving business landscape, ultimately driving your organization toward greater success.
Now, we invite you to take the next step and begin your own exploration of forecasting in Power BI. What insights are you eager to uncover, and how will you leverage them to drive your organization’s success? We look forward to hearing your thoughts and experiences in the comments below.


