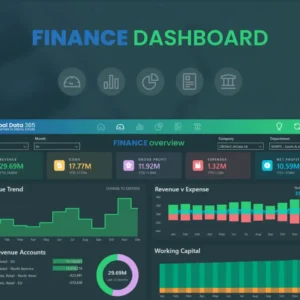
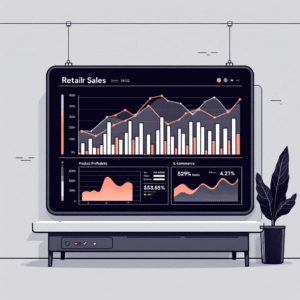
In today’s data-driven world, efficiently analyzing and visualizing large datasets is essential for businesses and organizations to make informed decisions. Microsoft Power BI has emerged as a powerful business intelligence tool that enables users to create stunning visualizations and gain actionable insights from their data. One of the core features that makes Power BI so effective is its filtering functionality.
Filters in Power BI allow users to refine their data, ensuring that reports and dashboards focus on the most relevant information. Whether you’re analyzing sales performance, customer trends, or operational metrics, filters help narrow down large datasets, making it easier to identify key patterns and trends. By applying filters, users can customize the data displayed in their reports based on specific criteria, such as date ranges, product categories, or geographic locations.
Power BI offers several types of filters, including basic filters, which allow users to include or exclude specific values; advanced filters, which enable more complex conditions; and Top N filters, which highlight the highest or lowest performing items. Additionally, slicers provide a visual way to filter data directly on the report canvas, enhancing interactivity.
By mastering filters, users can unlock the full potential of Power BI, transforming their data analysis into a more focused, efficient, and impactful process. Effective use of filters not only enhances report clarity but also ensures stakeholders can make data-driven decisions with confidence.
In this comprehensive guide, we’ll take a deep dive into Power BI filters—what they are, how they work, and most importantly, how you can leverage them to transform your data analysis. You’ll discover how filters refine your data, optimize performance, create custom views, and reveal hidden patterns and trends. By the end of this guide, you’ll be ready to unlock the full potential of Power BI filters in your reporting process.
The Importance of Filters in Data Analysis
Before diving into the different types of filters in Power BI, it’s important to understand why filters are such an essential component of data analysis. Filters serve several key purposes, including:
In today’s data-driven world, the ability to efficiently analyze vast amounts of data is essential for making informed business decisions. Microsoft Power BI has become one of the most powerful tools for data visualization, offering a wide range of features to help users extract insights from their data. Among these features, filters stand out as an indispensable tool for refining data, optimizing performance, creating customized views, revealing deeper insights, and fostering interactive reporting.
- Data Refinement
One of the primary challenges of working with large datasets is the risk of information overload. Without the proper tools to manage and organize this data, it can be difficult to focus on the most relevant information. This is where Power BI filters come into play. Filters allow you to sift through massive datasets and target specific subsets of information that align with your business goals.
For instance, if you are analyzing a global sales dataset, filters can help you narrow down the results to a specific region, product category, or time period. By doing so, you can eliminate unnecessary noise and focus only on the data that matters most to your analysis. This refinement ensures that your reports are both clear and purposeful, driving more accurate insights. Filters not only improve clarity but also make it easier to communicate findings to stakeholders by showcasing only the most critical data.
- Performance Optimization
Another major benefit of using filters in Power BI is their ability to enhance the performance of your reports. As datasets grow larger, the processing time required to generate visualizations can increase, potentially leading to slow and unresponsive reports. Filters play a crucial role in mitigating this issue by reducing the volume of data processed in each visualization.
When you apply filters to a report, Power BI processes a smaller, more focused subset of the data, which reduces the load on the system. This leads to faster refresh times, smoother interactions, and overall better performance. For example, if you apply a filter that restricts a report to show sales data from only the last three months, the report will process only that specific period instead of the entire dataset, resulting in faster load times.
Performance optimization through filters is particularly important when dealing with large datasets, real-time data, or complex visualizations. By ensuring that your reports are responsive and efficient, you can provide a better user experience and maintain the engagement of your audience.
- Customized Views
Filters in Power BI are not just about improving performance—they also allow for highly customized views of the data. Different stakeholders within an organization often have varying informational needs. For example, executives may want a high-level overview of company performance, while managers and analysts may require more granular data for operational insights. Filters help address these diverse needs by enabling users to tailor reports to their specific roles and responsibilities.
With filters, you can create dynamic, personalized reports for each stakeholder. An executive may only need to see top-level metrics like overall revenue or profit, whereas a sales manager might want to drill down into individual sales representatives’ performance in different regions. By applying filters, you ensure that each user can focus on the information most relevant to them, increasing the overall utility of the report.
Customized views also help drive better decision-making by presenting users with data that directly aligns with their objectives. When each stakeholder has access to the right data, they are better equipped to make informed, strategic decisions.
- Enhanced Insights
Filters also play a key role in uncovering hidden insights within your data. Large datasets can be overwhelming, making it difficult to spot trends and patterns. However, by applying filters, you can isolate specific data points and gain a clearer understanding of what’s happening beneath the surface.
For example, if you are analyzing sales data across multiple regions, a filter that narrows the report down to a single region can reveal underperforming locations that may require attention. Alternatively, you could apply a filter to a particular time period, such as a holiday season, to analyze how promotional efforts impacted sales during that time.
This ability to drill down into the data allows you to identify anomalies, outliers, and emerging trends that might otherwise go unnoticed in a larger dataset. Filters give you the flexibility to focus on specific segments of your data, providing more meaningful insights and a deeper understanding of your business performance.
- Interactive Reporting
Perhaps one of the most valuable aspects of filters in Power BI is their role in creating interactive, dynamic reports. Filters empower users to interact with the data directly, turning static reports into powerful exploratory tools. Rather than presenting users with fixed views of the data, filters allow them to explore different facets and perspectives.
For instance, using slicers (a type of interactive filter) on a report allows users to change the displayed data with a simple click, such as switching between different product categories or time frames. This interactivity fosters a deeper engagement with the data, as users can explore various scenarios and draw their own conclusions.
Interactive reporting is particularly valuable for teams that need to collaborate on data analysis. By enabling users to customize their views on the fly, filters make it easier to compare different data points, test hypotheses, and generate actionable insights. Additionally, the ability to quickly adjust filters ensures that users can explore the data in real time, making it easier to address immediate questions or concerns.
Types of Filters in Power BI
Power BI provides several types of filters, each designed to cater to different scenarios and analysis needs. Let’s explore these filters and how you can use them effectively:
- Basic Filters
Basic filters are the most straightforward and commonly used filter type in Power BI. They allow users to include or exclude specific values within a column.
How to use basic filters:
- Select a field from the Fields pane.
- Click the filter icon next to the field name.
- Choose the values to include or exclude.
- Apply the filter to update the visual.
Example: Imagine you’re working with a dataset of product sales and want to focus on just the electronics category. You can use a basic filter to exclude non-electronic items from the report.
Pro tip: Use the search bar within the filter pane to quickly locate specific values, especially when working with large datasets.
- Advanced Filters
Advanced filters offer more complex filtering options and let you create custom conditions based on multiple criteria.
How to use advanced filters:
- Select the filter icon and choose Advanced Filtering.
- Create a condition (e.g., “contains,” “does not contain,” “is greater than”).
- Combine conditions with AND/OR logic if necessary.
- Apply the filter to refine your data.
Example: If you want to see products that have generated more than $10,000 in sales, you could set up an advanced filter to include only those products where the sales amount exceeds this threshold.
- Top N Filters
Top N filters allow you to highlight the highest or lowest performing items in your dataset.
How to use Top N filters:
- Click on the filter icon and select Top N.
- Choose whether to show the top or bottom results.
- Set the number of items to display.
- Select the measure you want to rank by (e.g., revenue, profit, or sales quantity).
Example: You may want to display the top 10 best-selling products. With Top N filters, you can easily configure your report to focus on the best-performing items based on revenue.
- Relative Date Filters
Relative date filters are extremely useful for analyzing data based on dynamic time periods, such as “last 30 days” or “current quarter.”
How to use relative date filters:
- Click on a date field in the Fields pane.
- Select Relative date filtering.
- Choose a preset time range (e.g., “Last week,” “This quarter”).
- You can also define a custom date range if needed.
Example: In a sales report, you could use relative date filters to only show data from the last 12 months, dynamically updating the data as time progresses.
- Slicer Filters
Slicers are interactive, on-canvas filtering tools that allow users to filter data visually.
How to use slicer filters:
- Select the Slicer visual from the Visualizations pane.
- Drag the field you want to filter by into the slicer.
- Customize the slicer’s appearance (dropdown, list, etc.) in the Format pane.
Example: In a report tracking marketing campaign performance, a slicer can be used to filter results by region or campaign type, allowing users to toggle between different perspectives with ease.
- Cross-Report Filters
Cross-report filters allow users to apply filters across multiple report pages, maintaining consistency in your data analysis.
How to use cross-report filters:
- Go to the View tab in Power BI Desktop.
- Select Sync Slicers to enable filter synchronization across pages.
- Apply filters to the visuals to ensure consistent results on all synced pages.
Example: If you’re building a sales report with multiple pages (overview, regional performance, product breakdown), cross-report filters can ensure the same filter (e.g., “Region”) is applied throughout the report.
- Drill-Through Filters
Drill-through filters enable users to navigate between report pages, maintaining context while providing a more detailed view of specific data points.
How to use drill-through filters:
- Create a destination page with detailed data.
- Drag relevant fields into the Drill-through bucket.
- On the source page, right-click a data point and select Drill through to navigate to the detailed view.
Example: If your report shows sales performance by region, you can set up a drill-through filter to allow users to click on a specific region and drill down to see the individual stores’ performance in that area.
Best Practices for Using Power BI Filters
Mastering filters in Power BI not only requires understanding the technical steps but also knowing how to apply them strategically. Here are some best practices to ensure you get the most out of your filters:
- Start with the End in Mind
Before applying filters, clearly define what questions you’re trying to answer. This will help you choose the most appropriate filters and avoid unnecessary complexity in your analysis.
- Use a Combination of Filter Types
Each filter type has its strengths. Don’t rely on just one—combine basic, advanced, and Top N filters to create nuanced and multi-dimensional analyses.
- Leverage Filter Hierarchies
If you’re working with hierarchical data, such as geographic regions or organizational structures, set up filter hierarchies to help users navigate from broader categories to more specific data points.
- Optimize Performance with Query Reduction
When working with large datasets, use filters to reduce the amount of data queried, which can significantly improve report performance.
- Provide Clear Instructions
If your report is intended for others to use, consider adding tooltips or text boxes that explain how to use the filters effectively.
- Test Filters Thoroughly
Always test your filters to ensure they work as expected and don’t result in conflicts or unexpected behavior. Test them with various combinations of visuals and interactions to ensure a smooth user experience.
- Use Bookmarks for Predefined Views
Create bookmarks with specific filter settings to provide users with predefined views. This saves time and offers easy access to commonly used data configurations.
- Implement Row-Level Security
Use row-level security (RLS) in combination with filters to ensure users only see the data they are authorized to view. This adds an extra layer of security to your reports.
Advanced Filter Techniques in Power BI
As you become more familiar with the basic filtering options, it’s worth exploring more advanced techniques that can elevate your Power BI reporting to the next level.
- Dynamic Filtering with Parameters
By creating parameters, you can allow users to dynamically adjust filter values, offering more flexibility and interactivity.
How to create dynamic filters:
- Create a new parameter using the New Parameter feature.
- Use this parameter within measures or calculated columns.
- Reference the parameter in visuals or slicers to allow users to adjust the data dynamically.
- Cross-Filtering and Visual Interactions
Power BI allows you to customize how different visuals interact with each other. Cross-filtering enhances user engagement by enabling a more cohesive exploration of data.
How to manage cross-filtering:
- Select a visual in the report canvas.
- Go to the Format tab and choose Edit interactions.
- Specify how each visual should respond when interacting with others (e.g., highlight, filter, or none).
Conclusion: Harnessing the Power of Filters in Your Power BI Reports
Understanding and mastering filters in Power BI is essential for creating insightful, dynamic, and user-friendly reports. Filters play a critical role in refining datasets, enhancing performance, and enabling users to focus on the most relevant data. By applying filters, users can better customize visualizations, uncover hidden patterns, and drive meaningful business decisions.
At its core, filtering in Power BI allows you to reduce the complexity of large datasets by narrowing the focus to specific values, dates, categories, or other relevant criteria. By doing so, you can streamline your reports and dashboards, making them easier to interpret and act upon. Basic filters are the most common type, allowing users to include or exclude specific values within a column. These filters are ideal when you want to focus on specific product categories, regions, or customer segments without overwhelming your audience with too much information.
However, when dealing with more complex datasets, advanced filters come into play. They allow you to set custom conditions using criteria such as “is”, “is not”, “contains”, or “does not contain”. You can even combine multiple conditions using AND/OR operators, which lets you refine the data more precisely. This is especially useful for more detailed data analysis, such as isolating customers who made purchases during a specific timeframe or identifying products that meet certain sales thresholds.
Another powerful feature in Power BI is the Top N filters, which enable users to rank data by a specific measure (e.g., sales or profit) and focus on the highest or lowest performers. This type of filter is ideal when you want to showcase your top-selling products, highest revenue-generating regions, or best-performing employees. It provides a quick way to highlight key metrics that can drive business growth.
One of the more dynamic filtering options is relative date filters, which allow you to filter data based on rolling timeframes, such as the last 30 days or the current quarter. This is especially useful for tracking real-time performance or analyzing trends over specific periods without manually updating the filters.
Power BI also provides interactive filtering options through slicers. Slicers are visual elements that allow users to filter data directly on the report canvas, making it easy to adjust views on the fly. This enhances the interactivity of the reports, as users can quickly toggle between different data slices without needing to access the filter pane. Slicers work well in dashboards or presentations where users want to explore different dimensions of the data dynamically.
For more complex reporting environments, cross-report filters and drill-through filters add another layer of flexibility. Cross-report filters allow you to synchronize filters across multiple report pages, ensuring consistency in your analysis. Drill-through filters enable users to navigate between report pages while maintaining context, offering a deeper dive into specific data points. These advanced filtering techniques are valuable for large-scale reporting environments where consistency and detail are crucial.
As you become more comfortable with Power BI filters, it’s important to follow best practices to get the most out of your analysis. Begin by clearly defining the questions you want to answer and the insights you hope to gain. This ensures that your filters align with your goals and provide relevant information. Additionally, consider using a combination of filter types to get a more comprehensive view of your data. For example, combining basic and advanced filters can give you a more nuanced understanding of your dataset.
Finally, as you implement these techniques, continue experimenting with new filtering methods and pushing the boundaries of what Power BI can do for your business. Remember, effective filters are not just about the technology—they’re about asking the right questions, aligning your analysis with your business objectives, and empowering decision-makers with actionable insights. By mastering the use of filters, you can unlock the full potential of Power BI and take your data analysis to new heights.


