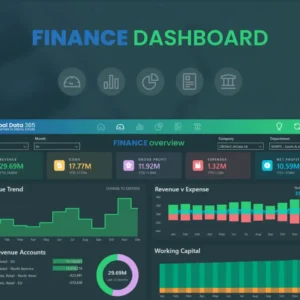
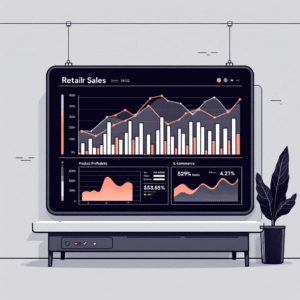
In today’s dynamic business landscape, effective inventory forecasting and demand planning are crucial for businesses to optimize their operations and meet customer expectations. In this blog, we will explore how Power BI, a powerful business intelligence tool, can be leveraged for inventory forecasting and demand planning. Join us as we dive into the capabilities of Power BI, discuss key strategies and best practices, and demonstrate how organizations can harness its features to make data-driven decisions and achieve inventory optimization.
Understanding Power BI for Inventory Forecasting and Demand Planning:
To effectively utilize Power BI for inventory forecasting and demand planning, it’s essential to understand its core functionalities and features:
- Data Integration and Transformation: Power BI allows seamless integration and transformation of data from various sources, such as ERP systems, POS data, and historical sales records. This consolidated data forms the foundation for accurate forecasting and demand planning.
- Visual Analytics and Reporting: With Power BI’s intuitive visualizations and interactive reports, users can analyze historical data, identify trends, and gain insights into inventory performance and demand patterns. This visual approach enhances decision-making and improves forecasting accuracy.
- Advanced Analytics and Forecasting Models: Power BI offers advanced analytics capabilities, including built-in forecasting models, regression analysis, and time series forecasting. These features enable organizations to predict future demand accurately and optimize inventory levels.
Best Practices for Inventory Forecasting and Demand Planning with Power BI:
To achieve optimal results in inventory forecasting and demand planning using Power BI, consider the following best practices:
- Data Cleansing and Preparation: Ensure that your data is clean, accurate, and consistent before importing it into Power BI. Proper data cleansing and preparation lay the foundation for reliable forecasting and demand planning.
- Granularity and Aggregation: Determine the appropriate level of granularity for your inventory data. Power BI allows you to aggregate data at different levels, such as product categories or geographical regions, to analyze trends and make informed decisions.
- Identifying Demand Drivers: Analyze external factors, such as seasonality, marketing campaigns, and economic trends, that influence demand for your products. Incorporate these drivers into your forecasting models for more accurate predictions.
Building Inventory Forecasting Dashboards with Power BI:
Creating inventory forecasting dashboards in Power BI involves the following steps:
- Identify Key Performance Indicators (KPIs): Determine the KPIs that align with your inventory forecasting and demand planning goals. These may include metrics such as inventory turnover, stock-out rates, and forecast accuracy.
- Select Appropriate Visualizations: Choose the appropriate visualizations, such as line charts, bar charts, and heat maps, to represent your inventory and demand data effectively. Use visual cues, such as color coding and conditional formatting, to highlight key insights.
- Utilize Forecasting and Trend Analysis: Leverage Power BI’s built-in forecasting models and trend analysis features to predict future demand. Visualize forecasted values alongside historical data to identify potential gaps and make proactive inventory decisions.
Conclusion:
Power BI offers robust capabilities for inventory forecasting and demand planning, enabling organizations to optimize their inventory levels, meet customer demands, and improve operational efficiency. By harnessing the power of Power BI’s data integration, visual analytics, and advanced forecasting models, businesses can make data-driven decisions, reduce costs, and stay competitive in today’s fast-paced marketplace.


