In the ever-evolving digital landscape, efficient IT operations and infrastructure monitoring are essential for businesses to ensure optimal performance and minimize downtime. As a Power BI expert, I’ll guide you through the powerful capabilities of Power BI in IT operations analytics and infrastructure monitoring. Discover how Power BI’s advanced analytics and data visualization tools can transform your IT operations and streamline infrastructure management.
Understanding IT Operations Analytics
IT operations analytics involves the use of data to monitor and analyze the performance of IT systems, applications, and services. With Power BI’s comprehensive data integration and transformation capabilities, IT professionals can gain deeper insights into IT operations, identify bottlenecks, and make data-driven decisions to enhance overall efficiency.
Visualizing IT Performance Metrics
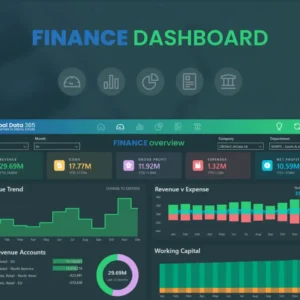
Power BI’s data visualization tools enable IT teams to create interactive dashboards that present key performance metrics in real-time. From network performance to server utilization, visualize critical data to quickly assess the health of IT systems and proactively address potential issues.
Monitoring Network Performance
Power BI allows IT professionals to monitor network performance metrics, including bandwidth usage, latency, and packet loss. Real-time visualizations help identify network issues promptly, ensuring uninterrupted connectivity for users.
Analyzing Server Utilization
Efficient server management is crucial for IT operations. With Power BI, IT teams can analyze server utilization metrics, such as CPU, memory, and disk usage. Data-driven insights aid in optimizing server resources and ensuring smooth application performance.
Application Performance Insights
Power BI’s analytics capabilities extend to application performance monitoring. Visualize key application metrics, including response time, throughput, and error rates. Analyzing application data helps IT professionals troubleshoot performance issues and enhance user experience.
Infrastructure Capacity Planning
Power BI empowers IT teams to perform infrastructure capacity planning. By visualizing data on resource consumption trends, IT professionals can forecast future capacity requirements and allocate resources more effectively.
Real-Time Alerts and Notifications
Power BI’s real-time alerting features enable IT professionals to receive notifications when predefined thresholds are exceeded. Proactive alerts help identify potential issues before they escalate, allowing for timely resolution.
Identifying Anomalies with Power BI AI
Power BI’s AI capabilities, including anomaly detection, assist IT teams in identifying irregular patterns and potential security threats. The AI-driven insights enhance IT operations’ resilience and minimize cybersecurity risks.
Root Cause Analysis
Power BI’s ability to correlate data from different sources simplifies root cause analysis. IT teams can trace issues across systems and identify the underlying causes, leading to quicker problem resolution.
Data-Driven Decision Making for Incident Management
Power BI enables IT professionals to generate incident reports and analyze historical incident data. These insights empower data-driven decision-making for incident management and continuous improvement.
Customizing IT Reports and Dashboards
Power BI’s flexible reporting features allow IT professionals to tailor reports and dashboards to meet specific IT operations’ needs. Customizable visuals ensure the most relevant data is readily available.
Conclusion
Power BI’s advanced analytics and data visualization capabilities have revolutionized IT operations analytics and infrastructure monitoring. By harnessing Power BI’s real-time insights, IT teams can enhance performance, proactively address issues, and optimize resource allocation. Empower your IT operations with Power BI and ensure a seamless and efficient digital infrastructure.


