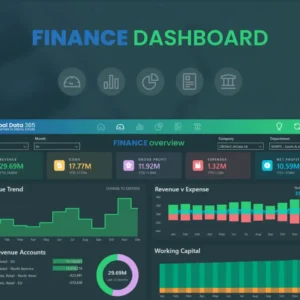
Ultimate Cash Flow Dashboard Template for Power BI
Track Liquidity Like a Pro with Advanced Analytics and Real-Time Insights
Transform Your Financial Analysis with Professional Cash Flow Dashboards
In today's fast-paced business environment, maintaining optimal cash flow is critical for organizational success. A Power BI cash flow dashboard serves as your financial command center, providing real-time visibility into your company's liquidity position, cash movements, and financial health. Our comprehensive cash flow dashboard template empowers finance professionals, CFOs, and business leaders to make data-driven decisions with confidence.
Cash flow management represents one of the most crucial aspects of financial stewardship. According to recent studies, 82% of businesses fail due to poor cash flow management rather than lack of profitability. This statistic underscores the vital importance of implementing robust cash flow monitoring systems that provide actionable insights into your organization's financial trajectory.
Our ultimate Power BI cash flow dashboard template combines cutting-edge analytics with intuitive design, delivering a comprehensive solution that transforms raw financial data into strategic business intelligence. Whether you're managing a small startup or overseeing enterprise-level operations, this dashboard template provides the tools necessary to optimize liquidity management and drive sustainable growth.
Ready to Transform Your Cash Flow Management?
Get expert guidance on implementing our Power BI cash flow dashboard template
Key Features of Our Power BI Cash Flow Dashboard Template
Real-Time Cash Position
Monitor your current cash position across all accounts with live updates and automatic data refresh capabilities.
Cash Flow Forecasting
Predict future cash flows using advanced algorithms and historical trend analysis for strategic planning.
Liquidity Analytics
Comprehensive liquidity ratios and metrics to assess your organization's short-term financial stability.
Trend Analysis
Identify patterns and trends in cash flow movements to optimize financial decision-making processes.
🎯 Why Choose Our Cash Flow Dashboard Template?
Our template is specifically designed for Power BI users who demand professional-grade financial analytics without the complexity of building dashboards from scratch. With pre-configured measures, calculated columns, and optimized data models, you can deploy enterprise-level cash flow monitoring in minutes rather than months.
Essential Cash Flow KPIs and Metrics
Effective cash flow management relies on tracking the right key performance indicators (KPIs). Our Power BI cash flow dashboard template includes comprehensive metrics that provide deep insights into your financial performance:
| KPI Category | Metric Name | Description | Target Range |
|---|---|---|---|
| Liquidity | Current Ratio | Current Assets / Current Liabilities | 1.5 - 3.0 |
| Efficiency | Cash Conversion Cycle | Days to convert investments to cash | < 30 Days |
| Performance | Operating Cash Flow Ratio | Operating Cash Flow / Net Income | > 1.0 |
| Risk | Cash Coverage Ratio | Available Cash / Monthly Expenses | 3-6 Months |
| Growth | Free Cash Flow Yield | Free Cash Flow / Enterprise Value | > 5% |
Advanced Dashboard Components and Visualizations
Our Power BI cash flow dashboard template incorporates sophisticated visualization techniques that transform complex financial data into actionable insights. Each component is carefully designed to support different aspects of cash flow analysis and decision-making.
Cash Flow Waterfall Analysis
Visualizes cash flow movements from opening to closing balance
Identifies key contributors to cash flow changes
The waterfall chart provides a visual representation of how individual cash flow components contribute to your overall financial position, making it easy to identify areas of strength and concern.
Rolling 12-Month Cash Flow Trend
Rolling 12-month cash flow trends
Seasonal pattern identification and forecasting
Track long-term cash flow patterns and identify seasonal fluctuations that impact your business operations and planning strategies.
Dashboard Visualization Components
- Real-time Cash Position Gauges: Visual indicators showing current cash levels against predetermined thresholds and targets
- Cash Flow Forecasting Models: Predictive analytics based on historical data and business intelligence algorithms
- Accounts Receivable Aging Analysis: Detailed breakdown of outstanding receivables by aging categories
- Accounts Payable Optimization: Strategic insights into payment timing and cash flow optimization opportunities
- Liquidity Ratio Scorecards: Comprehensive assessment of short-term and long-term liquidity positions
- Cash Flow by Business Unit: Departmental and divisional cash flow analysis for operational insights
Implementation Best Practices and Data Integration
Successful implementation of a Power BI cash flow dashboard requires careful attention to data architecture, refresh schedules, and user access management. Our template includes comprehensive documentation and best practice guidelines to ensure optimal performance and reliability.
Data Source Integration
The dashboard template supports integration with multiple data sources, ensuring comprehensive cash flow visibility across your organization's financial ecosystem:
| Data Source Type | Integration Method | Refresh Frequency | Key Benefits |
|---|---|---|---|
| ERP Systems | Direct Connection | Real-time | Comprehensive financial data |
| Banking APIs | REST API | Hourly | Live cash positions |
| Excel Files | SharePoint/OneDrive | Daily | Manual data supplements |
| CRM Systems | OData/API | Daily | Sales pipeline insights |
| Cloud Databases | DirectQuery | Real-time | Scalable data architecture |
Security and Governance Considerations
Financial dashboards require robust security measures to protect sensitive information. Our template includes row-level security (RLS) configurations, user role management, and audit trail capabilities to ensure compliance with financial regulations and internal governance requirements.
🔒 Enterprise Security Features
Built-in security features include encrypted data connections, role-based access controls, and comprehensive audit logging to meet enterprise security standards and regulatory compliance requirements.
Customization and Advanced Analytics Capabilities
While our template provides comprehensive out-of-the-box functionality, every organization has unique requirements. The dashboard template is designed with flexibility in mind, allowing for extensive customization without compromising core functionality.
Advanced Analytics Features
- Machine Learning Integration: Leverage Power BI's AI capabilities for predictive cash flow modeling and anomaly detection
- Statistical Forecasting: Advanced time series analysis using exponential smoothing and ARIMA models
- Scenario Planning: What-if analysis tools for stress testing and strategic planning scenarios
- Correlation Analysis: Identify relationships between cash flow patterns and business drivers
- Variance Analysis: Automated variance reporting with intelligent insights and recommendations
- Benchmark Comparisons: Industry and peer group benchmarking for performance contextualization
Customization Options
The template architecture supports extensive customization to meet specific industry requirements and organizational preferences:
Visual Customization
Modify colors, fonts, and layouts to match your corporate branding and visual identity standards.
Metric Configuration
Add custom KPIs, modify calculation logic, and create industry-specific financial metrics.
Mobile Optimization
Responsive design ensures optimal viewing experience across all devices and screen sizes.
Automation Features
Scheduled reports, automated alerts, and notification systems for proactive cash flow management.
ROI and Business Impact of Effective Cash Flow Management
Implementing a professional cash flow dashboard delivers measurable business value through improved financial visibility, enhanced decision-making capabilities, and optimized working capital management. Organizations typically see significant returns on investment within the first quarter of implementation.
Quantifiable Business Benefits
Organizations implementing comprehensive cash flow dashboards report significant improvements in financial performance, risk management, and operational efficiency. The ability to identify cash flow trends early enables proactive management strategies that prevent liquidity crises and optimize growth opportunities.
💡 Success Story Highlights
Companies using our Power BI cash flow dashboard template have achieved average improvements of 15% in working capital efficiency, 25% reduction in accounts receivable days, and 30% better accuracy in cash flow forecasting. These improvements translate directly to enhanced financial flexibility and competitive advantage.
Getting Started: Implementation Roadmap
Deploying our Power BI cash flow dashboard template follows a structured approach that ensures successful implementation and user adoption. The process is designed to minimize disruption while maximizing the value delivered to your organization.
Phase-by-Phase Implementation
| Phase | Duration | Key Activities | Deliverables |
|---|---|---|---|
| Planning & Assessment | 1-2 Weeks | Requirements gathering, data audit, stakeholder interviews | Implementation plan, data mapping document |
| Data Integration | 2-3 Weeks | Data source connections, ETL setup, data validation | Configured data model, test data scenarios |
| Dashboard Configuration | 1-2 Weeks | Template customization, KPI setup, visual design | Customized dashboard, user acceptance testing |
| Testing & Validation | 1 Week | Data accuracy verification, performance testing, security review | Test results, security certification |
| Deployment & Training | 1 Week | Production deployment, user training, documentation | Live dashboard, trained users, support documentation |
Prerequisites and Requirements
- Power BI Pro or Premium License: Required for publishing and sharing dashboard across your organization
- Data Source Access: Appropriate permissions and connection capabilities to financial data sources
- IT Infrastructure: Adequate network bandwidth and security configurations for data integration
- User Training: Basic Power BI familiarity among end users for optimal dashboard utilization
- Data Governance: Established data quality standards and governance processes
- Change Management: Organizational readiness for adopting new financial reporting processes
Transform Your Financial Analytics Today
Don't let poor cash flow management threaten your business success. Get started with our proven Power BI cash flow dashboard template and expert implementation support.
Related Resources and Expert Guides
Expand your Power BI knowledge with our comprehensive collection of financial dashboard resources:


