Power BI has become a cornerstone in the world of business intelligence, transforming raw data into meaningful insights through interactive dashboards and reports. One of the key features that enhance the visual appeal and effectiveness of Power BI reports is the use of icons. In this article, we will dive deep into the concept of Power BI icons, their benefits, best practices, and how to effectively use them in your reports.
Introduction to Power BI Icons
What Are Power BI Icons?
Power BI icons are predefined visual symbols that can be used within reports and dashboards to represent various concepts, objects, or actions. These icons help in enhancing the visual communication of data, making it easier for users to interpret complex information quickly. Power BI offers a wide range of icons across different categories, such as data, business, technology, and people, which can be applied to represent data points or categories.
Icons serve as a visual shorthand, replacing or complementing textual data in reports. For instance, instead of using text to indicate a “completed” status, a simple checkmark icon can be used, making the report cleaner and more intuitive.
History and Evolution of Icon Usage in BI Tools
The use of icons in business intelligence tools has evolved significantly over the years. Initially, BI tools were focused purely on data processing and output, with little consideration for aesthetics or user experience. However, as data visualization became more important, the need for intuitive and visually appealing designs grew. Icons became a way to enhance user interaction, leading to better data interpretation and decision-making.
The integration of icons in Power BI is part of this broader trend towards more user-friendly and visually engaging BI tools. As Power BI continues to evolve, so too does the range of icons available, offering users more ways to customize and enhance their reports.

Benefits of Using Icons in Power BI
Enhanced Data Visualization
Icons are powerful tools for enhancing data visualization. They provide a visual shorthand for data, allowing users to quickly grasp the meaning of complex datasets without delving into detailed text explanations. For example, using a thumbs-up icon to represent positive growth or a warning icon for a critical alert makes the data more intuitive.
Example: Consider a dashboard that tracks sales performance across different regions. By using icons like upward and downward arrows to represent increases and decreases in sales, users can quickly understand trends at a glance without needing to read through numbers.
Improved User Engagement
Engaging users with your reports is crucial, especially in environments where data-driven decisions are key. Icons add a layer of visual interest that can capture users’ attention and keep them engaged. A well-designed report with appropriate icon usage can guide users through the data narrative, making the information more digestible.
Case Study: A retail company revamped its sales reports by incorporating icons to represent different product categories. This small change resulted in a 20% increase in report engagement from stakeholders, as they found the reports more visually appealing and easier to navigate.
Simplified Communication
Icons can convey messages more efficiently than text, reducing the cognitive load on users and making information more accessible. This is particularly useful in reports that need to be interpreted quickly or by a wide audience with varying levels of data literacy.
Example: In a project management dashboard, using icons to represent task statuses (e.g., a clock for pending tasks, a checkmark for completed tasks) can simplify communication and ensure that everyone on the team understands the current state of the project.
Consistency and Standardization
Using a consistent set of icons across reports ensures uniformity, making it easier for users to navigate and understand different reports. This is especially important in organizations where multiple teams are creating and sharing reports.
Best Practice Tip: Develop a standardized icon set for your organization that aligns with your brand guidelines. This not only ensures consistency but also reinforces your brand identity across all reports.
Types of Power BI Icons
Power BI provides various types of icons that can be used to enhance reports. Understanding the different categories can help you choose the right icon for the right context.
Data Icons

Data icons represent specific data points or categories, helping users quickly identify trends or anomalies. These icons are typically used in conjunction with metrics or KPIs to provide a visual representation of data.
Example: A report tracking customer satisfaction might use smiley faces as data icons, with different expressions representing different levels of satisfaction.
Action Icons

Action icons indicate actions or processes, such as sorting or filtering data. These icons are useful in interactive reports where users need to perform actions to manipulate the data view.
Example: In an interactive sales report, using action icons like filter and sort symbols helps users understand that they can interact with the data.
Status icons

show the status of a particular metric or KPI, such as a check mark for completed tasks or an exclamation mark for alerts. These icons are essential for dashboards that need to convey real-time information about the status of various business activities.
Example: In a project dashboard, using status icons to indicate task completion can provide a quick overview of project progress without the need for detailed text.
Custom Icons

While Power BI provides a robust set of built-in icons, there may be instances where you need something more specific to your needs. Custom icons allow you to tailor the visual experience of your reports to better suit your audience or specific business context.
Example: A healthcare provider might use custom icons representing different medical conditions or treatments, which are not available in the default Power BI icon set.
How to Apply Icons in Power BI
Step-by-Step Guide to Using Built-in Icons
Applying icons in Power BI involves using the conditional formatting feature. Here’s a step-by-step guide:
- Open Your Report: Start by opening your existing Power BI report or creating a new one.
- Select a Visual: Choose the visual or field where you want to apply the icon set.
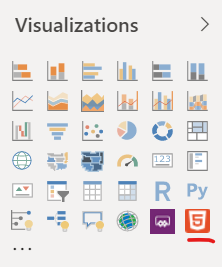
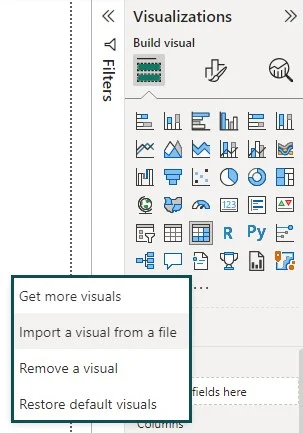
- Access Conditional Formatting: In the Visualizations pane, click on the drop-down arrow next to the field, select Conditional Formatting, and then choose the Icons option.
- Configure Icon Settings: In the Format window, specify the settings related to icons, such as format style, icon layout, and alignment. Choose the desired icons from the icon set under the Style header.
- Preview and Adjust: Preview the icon set and make adjustments as needed to achieve the desired visual representation.
- Save and Publish: Once satisfied, save and publish your Power BI report or dashboard to make the icon set visible to others.
Conditional Formatting with Icons
Conditional formatting with icons allows you to dynamically change the icons displayed based on the underlying data. This is particularly useful for highlighting important trends or outliers in your data.
Example: In a financial dashboard, you might use conditional formatting to display a green arrow icon for positive revenue growth and a red arrow for negative growth. This visual cue immediately tells users how the business is performing without needing to analyze the numbers.
Case Study: Transforming a Report with Icons
A mid-sized retail company struggled with low engagement in their monthly sales reports. The reports were text-heavy and did not provide an intuitive way to understand the data. By incorporating icons into their reports, they were able to transform the user experience. Sales figures were accompanied by trend icons (upward or downward arrows), and product categories were represented by custom icons that aligned with their branding.
The result? A 30% increase in report engagement and faster decision-making by the management team, as they could now quickly grasp key insights at a glance.
Customizing Icons in Power BI
While Power BI provides a set of built-in icons, users can also incorporate custom icons to tailor reports to specific needs. Customizing icons can enhance the visual appeal and relevance of your reports.
Using Custom Images and Icon Sets
One way to customize icons is by using custom images. These can be added as background images for shapes or as images within visuals to create unique icon visuals.
Example: A marketing team might use custom icons representing different social media platforms in their campaign performance report, making it easier to distinguish between metrics from Facebook, Twitter, Instagram, etc.
Importing Custom Icons with JSON Theme Files
Power BI allows users to import additional icons using JSON theme files. This method provides greater flexibility and personalization of reports, as you can import a wide range of icons that match your specific needs.
Step-by-Step Guide:
- Create a JSON File: First, create a JSON file that defines your custom theme, including the icon set you want to import.
- Import the Theme: In Power BI, go to the “View” tab and select “Themes.” Click “Browse for themes” and select your JSON file.
- Apply the Theme: Once the theme is imported, apply it to your report. The custom icons defined in the JSON file will now be available for use.
Advanced Customization Techniques
For those looking to push the boundaries of Power BI’s capabilities, there are advanced techniques for customizing icons. This might include using SVG files for scalable icons, integrating third-party icon libraries, or even using Power BI’s custom visuals marketplace to find specialized icon sets.
Pro Tip: Always test custom icons on different devices and screen sizes to ensure they render correctly and maintain their visual integrity.
Enhancing Power BI Visuals with Icons
Icons can be a powerful tool in Power BI, transforming standard visuals into more engaging, informative, and visually appealing components of a report. By integrating icons, you can make your data more accessible and easier to interpret. Here’s a closer look at how icons can enhance some of the most popular Power BI visuals and the best practices to follow for their effective use.
Bar Charts
Bar charts are among the most frequently used visuals in Power BI due to their simplicity and effectiveness in comparing different categories. However, you can further enhance their impact by adding icons.
Example: Imagine a report where you need to compare the performance of different departments within a company. Instead of just labeling each bar with text, you can place a corresponding icon at the end of each bar—like a briefcase for the sales department, a wrench for maintenance, and a clipboard for human resources. This visual cue helps users quickly associate each bar with the respective department, improving the report’s clarity and visual engagement.
Implementation Tip: To apply icons in bar charts, use the conditional formatting feature within Power BI. You can assign specific icons to each category, helping to reinforce the information presented in the chart.
Line Charts
Line charts are essential for tracking trends over time, making them perfect for visualizing data like sales performance, stock prices, or website traffic. However, line charts can sometimes appear monotonous or challenging to interpret, especially when multiple lines are present. Icons can break this monotony and highlight critical data points.
Example: In a sales performance line chart, you could use icons to mark significant events that explain spikes or dips in sales. For instance, a shopping cart icon could indicate a product launch, a discount tag icon could mark a promotional period, and a calendar icon could denote the end of a fiscal quarter. These icons provide context to the data, allowing users to understand the underlying reasons for changes in trends.
Implementation Tip: When using icons in line charts, ensure they do not clutter the visual. Place them strategically at key points on the timeline, such as peaks, troughs, or intersections.
Pie Charts
Pie charts are excellent for showing the composition of a whole, such as market share or budget allocation. Icons can emphasize particular segments or make the chart more visually engaging.
Example: If you’re creating a market share pie chart, you can use company logos as icons to represent each competitor. This method not only makes the chart more visually appealing but also helps users quickly identify the brands being represented. Instead of reading through a legend, users can immediately recognize which segment belongs to which company, enhancing the speed and efficiency of data interpretation.
Implementation Tip: Use icons that are clear and distinct, especially in pie charts where space is limited. Ensure that each icon is easily recognizable and not too detailed, as this can reduce legibility.
Maps and Geo-spatial Visuals
Maps and geo-spatial visuals are powerful tools for analyzing geographical data. By incorporating location-based icons, you can provide additional context and make the visual more informative.
Example: Suppose you’re analyzing a company’s store locations across a country. You could use different icons to represent various types of stores—such as a retail store icon, a warehouse icon, and an outlet store icon. This approach helps users quickly understand the geographical distribution and types of assets without needing to refer to a separate legend or text description.
Implementation Tip: When using icons on maps, consider the map’s scale and ensure that icons are appropriately sized. Too many icons in close proximity can create visual clutter, so use clustering techniques or filters to manage the display of icons effectively.
Tables and Matrices
Tables and matrices are fundamental for displaying detailed data in a structured format. However, they can sometimes be overwhelming due to the sheer volume of information. Icons can simplify the data interpretation process by adding visual indicators that highlight key metrics or statuses.
Example: In a financial matrix that tracks departmental budgets, you could use icons to indicate whether a department is on track, under budget, or over budget. For instance, a green check mark could show that the department is meeting its budget, a yellow warning sign could indicate that they are close to exceeding it, and a red cross could signify that the budget has been exceeded. These visual cues help users quickly assess performance without needing to analyze the numbers in detail.
Implementation Tip: Apply conditional formatting to add icons to tables and matrices. Ensure that the icons are appropriately sized and aligned within the cells to maintain the table’s readability and professional appearance.
Best Practices for Using Icons in Power BI
While icons can significantly enhance Power BI reports, their effectiveness depends on how they are used. Here are some best practices to consider:
Consistency in Icon Usage
Consistency is crucial when using icons across Power BI reports. A consistent approach ensures that users understand the meaning of each icon without confusion. This is particularly important in large reports where multiple icons are used.
Example: If you use a green check mark to indicate success in one section of your report, use the same icon for similar meanings throughout the entire report. Inconsistent icon usage can lead to misunderstandings and reduce the overall effectiveness of your report.
Best Practice Tip: Create a style guide for your Power BI reports that outlines the icons to be used for specific scenarios. This guide can serve as a reference for all report creators within your organization, ensuring uniformity and clarity.
Avoiding Overcrowding
While icons can enhance the visual appeal of a report, too many icons can lead to clutter and confusion. It’s important to use icons sparingly and strategically.
Pro Tip: Limit the number of icons per visual to no more than three. This keeps the focus on the most important data points without overwhelming the user. In visuals where more icons might be necessary, consider using grouping techniques or layered visuals to manage the display effectively.
Ensuring Accessibility
Accessibility is a key consideration when designing Power BI reports. Icons should be easily recognizable and accessible to all users, including those with visual impairments.
Accessibility Tip: Choose icons with high contrast, use text labels alongside icons, or ensure that icons are large enough to be seen clearly. Power BI’s accessibility checker can help ensure that your icons are compliant with accessibility standards, such as the Web Content Accessibility Guidelines (WCAG).
Aligning Icons with Branding
Aligning icons with your organization’s branding can create a cohesive look and feel across your reports. This might involve using your company’s color palette, logo, or custom-designed icons.
Example: A company that uses a specific color scheme in its branding might customize the icons in Power BI to match those colors. This creates a unified brand experience across all reports, reinforcing brand identity.
Best Practice Tip: Work with your design or branding team to develop a set of custom icons that align with your brand guidelines. Incorporating these into Power BI reports can enhance both the aesthetic and the professional presentation of your data.
Troubleshooting Common Issues
Even with careful planning, issues may arise when using icons in Power BI. Common problems include icons not displaying correctly, icons overlapping with text, or icons not being clear enough. Here’s how to troubleshoot these issues:
- Icon Not Displaying: Check that the icon is correctly linked in the conditional formatting settings. If you’re using custom icons, ensure that the file path is correct and that the icon file is accessible.
- Overlapping Icons: Adjust the size and placement of icons to prevent them from overlapping with text or other visual elements. Use the alignment options in the Format pane to fine-tune their position.
- Unclear Icons: If an icon isn’t clear or is too detailed, consider replacing it with a more recognizable symbol or adding a text label for clarification.

Conclusion
Power BI icons are a powerful tool that can significantly enhance the visual appeal and effectiveness of your reports. By incorporating icons, you can create more engaging and insightful reports that communicate data stories more effectively. Icons serve as visual shorthand, helping users quickly interpret complex information, whether they are seasoned Power BI users or newcomers.
Applying and customizing icons in your Power BI reports allows you to simplify data visualization, improve user engagement, and make your reports more intuitive. Icons can represent data points, indicate actions, or show statuses, making it easier for users to grasp key insights at a glance.
As Power BI continues to evolve, the range of available icons and customization options is expected to expand, offering even more opportunities to enhance your reports. By staying updated with these developments and continually refining your use of icons, you can ensure that your Power BI reports remain effective, visually appealing, and aligned with the latest best practices in data visualization.
How have you used icons in your Power BI reports to enhance data visualization, and what impact did it have on user engagement and understanding? Share your experiences and insights in the comments below!