Power BI Finance Dashboard Templates & Use Cases
Ready-to-use, customizable dashboards for every key financial report — built to save time, reduce errors, and deliver clarity.
Our Dashboard Templates
1. Executive KPI Dashboard
Get a bird’s-eye view of financial performance.
- Revenue, Gross Margin, Net Profit
- Liquidity ratios & Debt-to-Equity
- ROI & Working Capital insights
Best for: CFOs and finance leaders tracking company-wide performance.
Keywords: financial KPIs dashboard, financial health dashboard, CFO dashboard.


2. Profit & Loss (P&L) Dashboard
Interactive reporting that goes beyond spreadsheets.
- Track revenue, expenses, and net income by period
- Drill into product lines, geographies, or cost centers
- Compare actuals vs budget instantly
Keywords: P&L dashboard Power BI, Power BI financial reports, profit & loss analysis Power BI.
3. Cash Flow Statement Dashboard
Visualize liquidity and optimize runway.
- Inflows/outflows by operating, investing, and financing activities
- Cash burn rate and runway projections
- Variance vs prior periods
Best for: Founders, CFOs, and treasury teams.
Keywords: cash flow statement Power BI, cash flow management dashboard.


4. Balance Sheet Dashboard
Automate balance sheet reporting and ratio analysis.
- Assets, liabilities, equity visualizations
- Debt service & solvency tracking
- Trend analysis across periods
Keywords: balance sheet Power BI, financial statement analysis Power BI.
5. Budget vs Actuals Dashboard
Stay on top of performance variances.
- Budget vs Actuals variance by department or project
- Rolling forecast vs actuals
- Drill-through to root causes
Keywords: budget vs actuals Power BI, variance analysis dashboard


6. Multi-Entity Consolidation Dashboard
Unify multiple subsidiaries into one financial view.
- Consolidate different currencies, charts of accounts
- Eliminate intercompany transactions
- Present group-level performance instantly
Keywords: multi-entity consolidation Power BI, automating financial consolidation with Power BI.
7. Operational Expense Dashboard
Track costs and improve efficiency.
- Expense breakdown by category
- Opex vs revenue ratios
- Cost per unit and efficiency metrics
Keywords: operational efficiency analysis, Power BI for accounting.

Use Cases by Role
Our templates empower various financial roles with tailored solutions:

CFOs
Investor-ready performance dashboards, cash flow clarity, and continuous KPI monitoring.
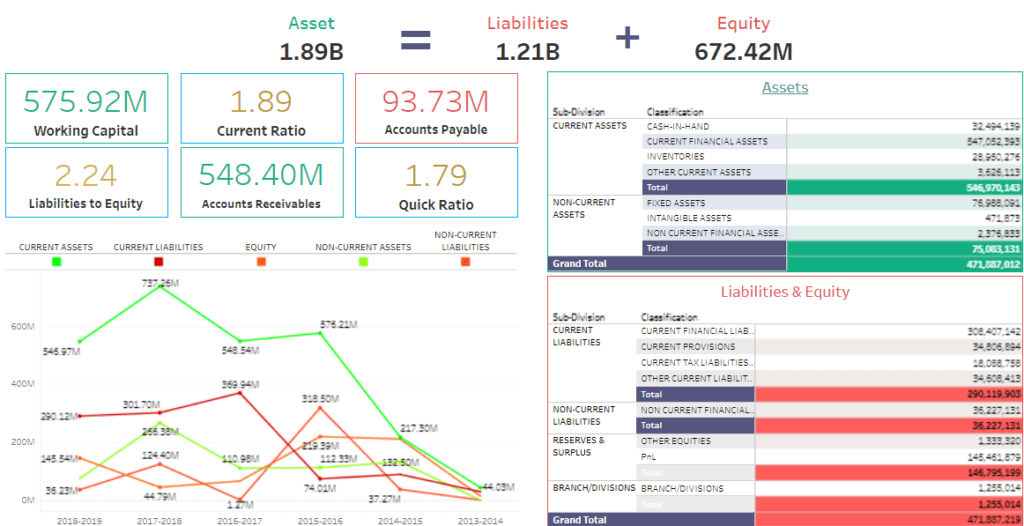
Controllers
Variance analysis, reconciliation, audit-ready reporting
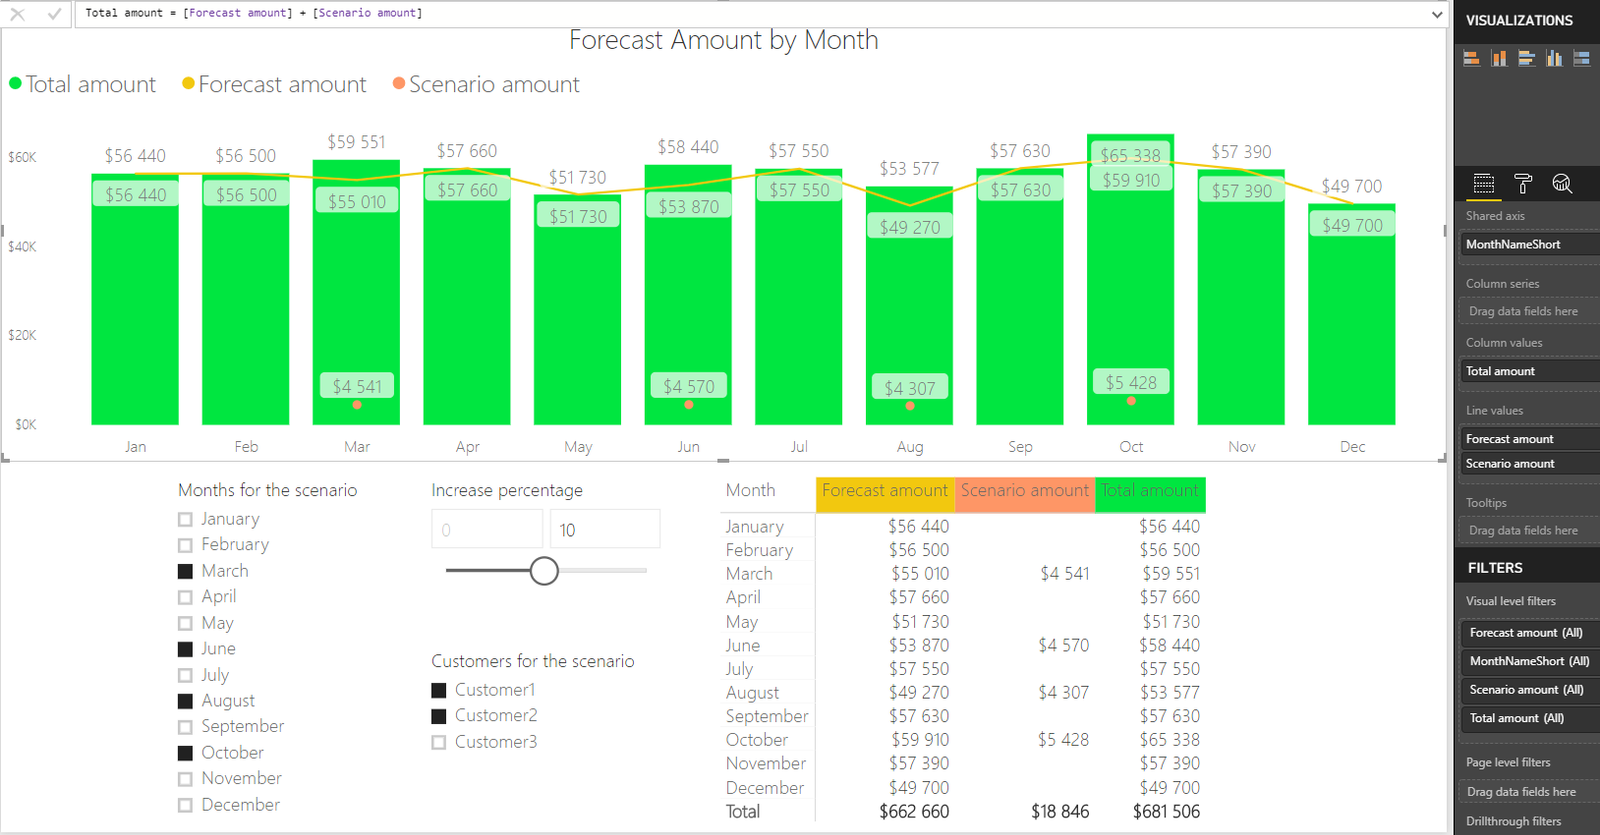
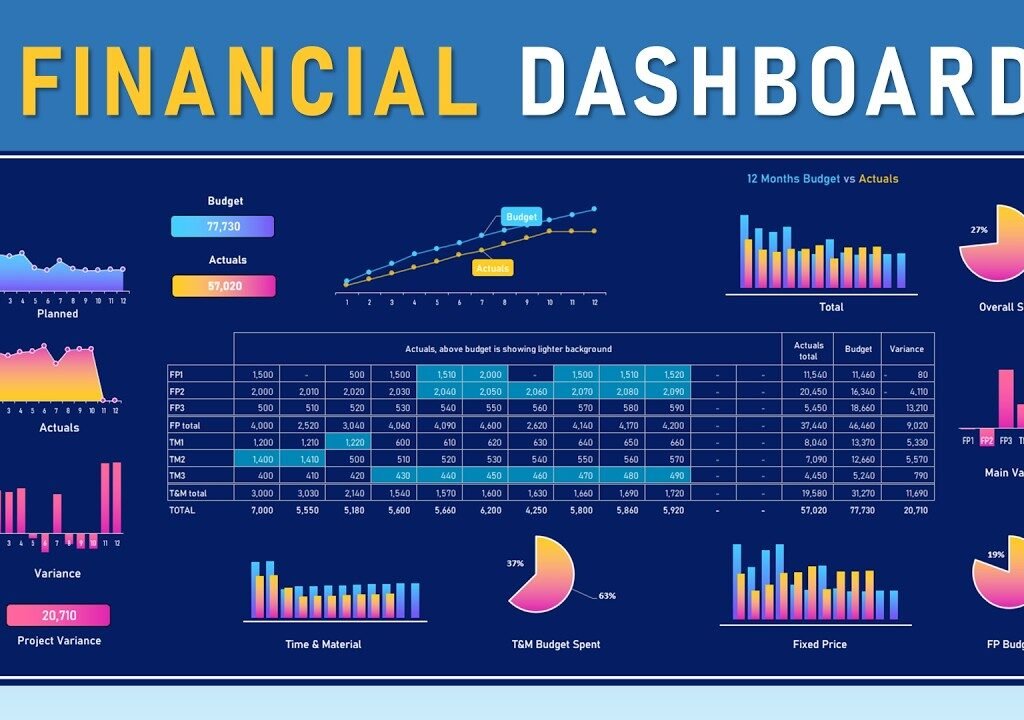
Financial Analysts:
Detailed DAX models, scenario planning, forecasting

Accountants:
Month-end close automation, P&L and balance sheet templates
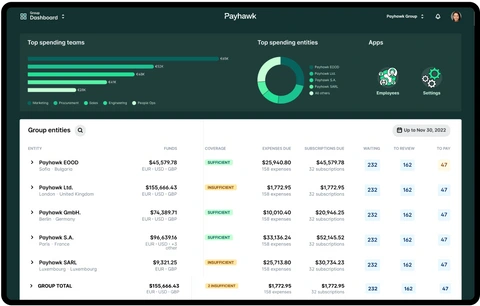
Use Cases by Industry

Startups
Burn rate, runway, fundraising dashboards

Retail & E-commerce:
Sales trends, product/category profitability

Healthcare:
Cost per patient, departmental budget control

Manufacturing:
Inventory, cost of goods sold, efficiency ratios
Why Templates Work
Designed for immediate impact and long-term value, our templates deliver significant advantages:
Faster Deployment:
Start with pre-built dashboards, customize in hours not weeks
Finance-First Design:
Built by finance experts, not just BI developers
Scalable & Customizable:
Adapt templates to fit your exact reporting structure

Get Dashboards That Work From Day One
Download our sample Power BI finance dashboard template or request a custom build.