In today’s complex and globalized business environment, supply chain management is a critical function that can make or break an organization’s success. Effective supply chain management involves coordinating and optimizing a network of suppliers, manufacturers, distributors, and other stakeholders to ensure efficient and cost-effective delivery of goods and services to customers.Building a supply chain dashboard with a powerful business intelligence tool like Power BI can greatly assist in streamlining these operations. A well-designed dashboard provides supply chain managers and executives with real-time data and insights, enabling better decision-making and process improvements.In this article, we will provide a step-by-step guide on how to build an effective and insightful supply chain dashboard using Power BI. We’ll cover everything from data preparation to visualization best practices, and provide tips on how to streamline your supply chain operations through data-driven analytics.
Understanding Supply Chain Dashboards
A supply chain dashboard is a visual representation of key performance indicators (KPIs) and metrics that provide insights into the health and performance of a supply chain. It aggregates data from various sources within the supply chain, such as inventory levels, production rates, lead times, and transportation metrics, to present a comprehensive overview.Dashboards are often used by supply chain managers, analysts, and executives to monitor and optimize the entire supply chain, from raw material sourcing to product delivery. They provide a single source of truth, enabling users to identify bottlenecks, inefficiencies, and areas for improvement at a glance.
Benefits of Supply Chain Dashboards
- Real-time data insights: Dashboards provide up-to-the-minute data, allowing users to make timely decisions and take immediate action when needed.
- Improved visibility: They aggregate data from various sources, providing a holistic view of the supply chain and improving communication between stakeholders.
- Enhanced decision-making: By presenting complex data in a visual and digestible manner, dashboards enable better decision-making based on facts and insights.
- Identifying bottlenecks: Supply chain dashboards help users identify bottlenecks and inefficiencies, allowing for process improvements and cost reductions.
- Tracking KPIs and metrics: Dashboards provide a centralized place to track and monitor key performance indicators, ensuring that supply chain operations are meeting targets and goals.
Step-by-Step Guide to Building a Supply Chain Dashboard with Power BI
Building a supply chain dashboard requires a systematic approach and a good understanding of the data and KPIs involved. Here’s a step-by-step guide to help you get started:
1. Identify KPIs and Metrics
The first step is to identify the key performance indicators and metrics that are relevant to your supply chain. These KPIs will form the foundation of your dashboard and provide insights into the specific areas of your supply chain that you want to monitor and improve.Examples of common supply chain KPIs include:
- On-time delivery: Measures the percentage of orders delivered to customers on or before the promised date.
- Inventory turnover: Represents how efficiently a company manages its inventory by calculating the number of times inventory is sold and replaced over a period.
- Days of inventory on hand: Indicates the average number of days a company holds inventory before selling it.
- Supply chain cycle time: Measures the total time it takes for a product to move through the supply chain, from raw material to finished goods.
- Perfect order metric: Tracks the percentage of orders that are complete, accurate, undamaged, and delivered on time.
2. Determine Data Sources
Once you have identified the KPIs, the next step is to determine the data sources that will provide the necessary information. This could include internal systems such as ERP, CRM, and warehouse management software, as well as external data sources like supplier and carrier systems.It’s important to assess the quality and reliability of these data sources and ensure that the data is accurate, consistent, and up-to-date. Data cleansing and transformation may be required to prepare the data for effective analysis and visualization.
3. Data Modeling and Relationships
In Power BI, you’ll need to create a data model that represents the relationships between your data sources. This involves importing data from the identified sources, transforming it into a usable format, and establishing relationships between tables.For example, you might have a table for “Orders” that is related to a “Products” table, which in turn is related to an “Inventory” table. Understanding and defining these relationships is crucial for accurate calculations and aggregation in your dashboard.
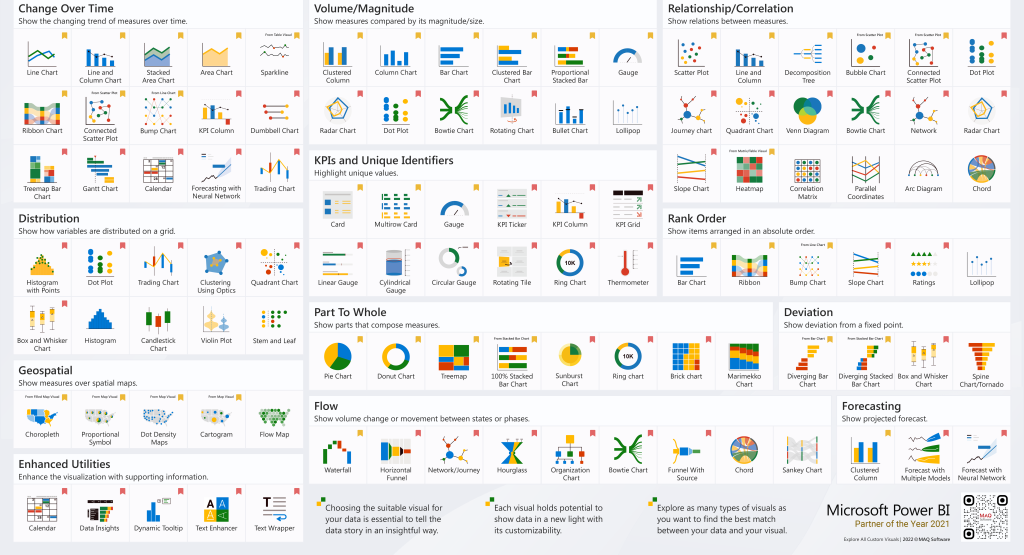
4. Choose the Right Visualizations
The choice of visualizations is critical to the effectiveness of your supply chain dashboard. Power BI offers a wide range of visual options, including charts, maps, gauges, and custom visuals. The key is to select the right visualization that best represents your data and conveys the intended message to the user.For example, a line chart might be suitable for tracking trends in on-time delivery over time, while a map could be used to visualize the distribution of suppliers or customers by region. Other common visualizations in supply chain dashboards include bar charts, scatter plots, and KPI gauges.
5. Dashboard Design and Layout
The design and layout of your dashboard should be well-structured and easy to navigate. Consider grouping related KPIs and metrics together to create logical sections within the dashboard. Use white space effectively to avoid clutter, and apply consistent formatting and color schemes to improve readability.Keep in mind that the goal is to provide a single-page overview of your supply chain performance. Ensure that the most critical information is visible at a glance, with the ability to drill down into specific areas for more detailed insights.
6. Interactive Features and Drill-Downs
Adding interactive features to your dashboard allows users to explore the data and gain deeper insights. In Power BI, you can create drill-down capabilities, allowing users to click on a visualization to reveal more detailed information.For example, clicking on a region in a map could filter the rest of the dashboard to show data specific to that region, or clicking on a particular product category could reveal its inventory levels, sales, and margins.
7. Real-time Data and Alerts
To ensure your supply chain dashboard is truly effective, consider incorporating real-time data and alerts. This allows users to monitor operations as they happen and take immediate action when issues arise.For instance, you could set up alerts to notify users when inventory levels fall below a certain threshold or when there are significant changes in lead times or delivery performance.
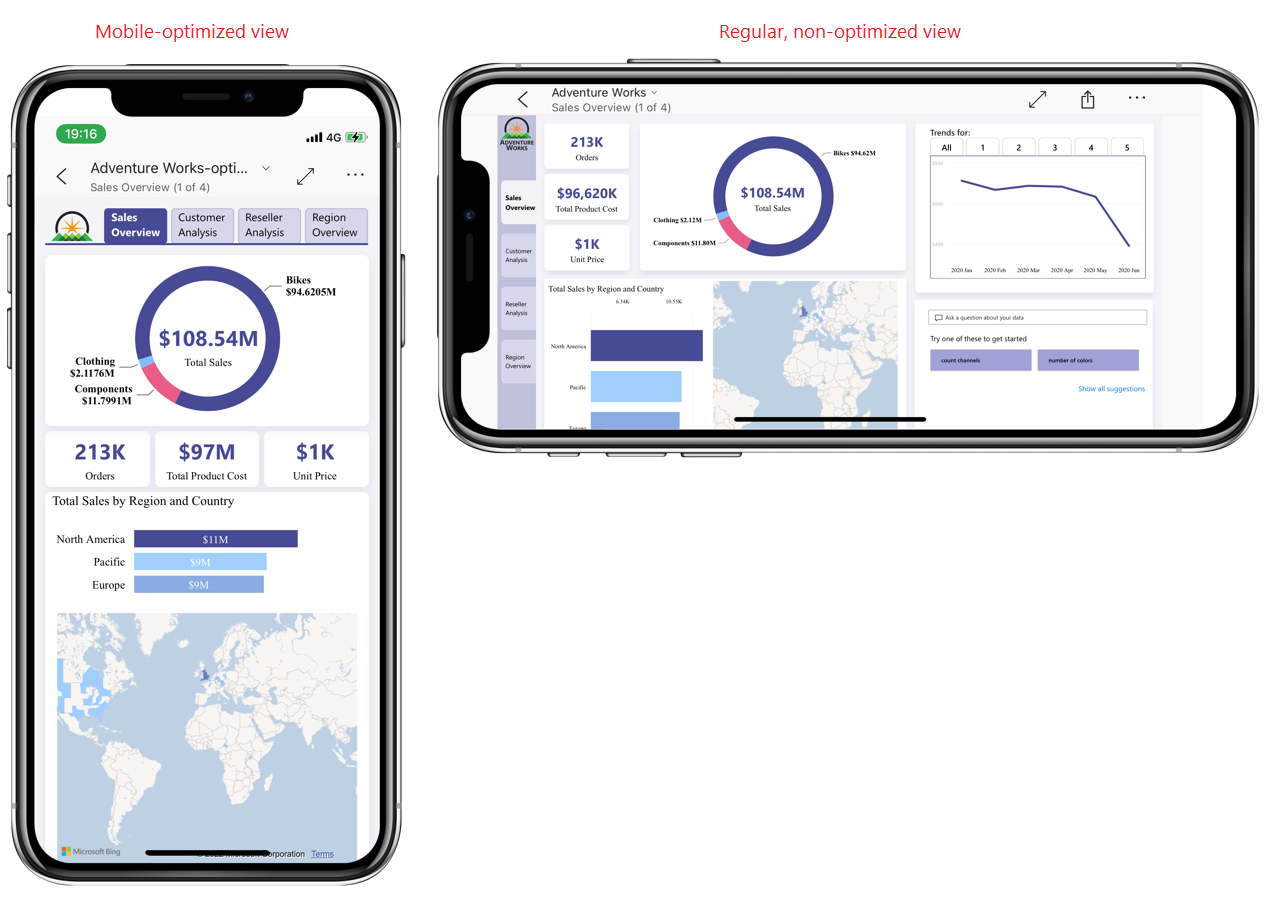
8. Mobile Accessibility
Given the dynamic nature of supply chain operations, it’s important to ensure that your dashboard is accessible on mobile devices. Power BI offers mobile apps for iOS and Android, allowing users to access their dashboards on the go. Optimize your dashboard design for mobile screens to ensure a seamless user experience.
Best Practices for Supply Chain Dashboards
Here are some additional best practices to keep in mind when building and utilizing your supply chain dashboard:
- Involve stakeholders: Engage with key stakeholders from across the supply chain to gather their input and ensure that the dashboard meets their needs.
- Keep it simple: Avoid information overload by focusing on the most critical KPIs and metrics. Simplicity and clarity are key to effective communication.
- Use consistent terminology: Ensure that the language and terminology used in the dashboard are consistent with industry standards and familiar to users.
- Provide context: Include clear labels, titles, and tooltips to provide context and help users understand the data being presented.
- Regularly review and update: Supply chain dynamics can change rapidly. Regularly review and update your dashboard to ensure it remains relevant and accurate.
- Share and collaborate: Power BI allows you to share dashboards and collaborate with colleagues. Encourage feedback and input to continuously improve the effectiveness of your dashboard.
Example Supply Chain Dashboard in Power BI
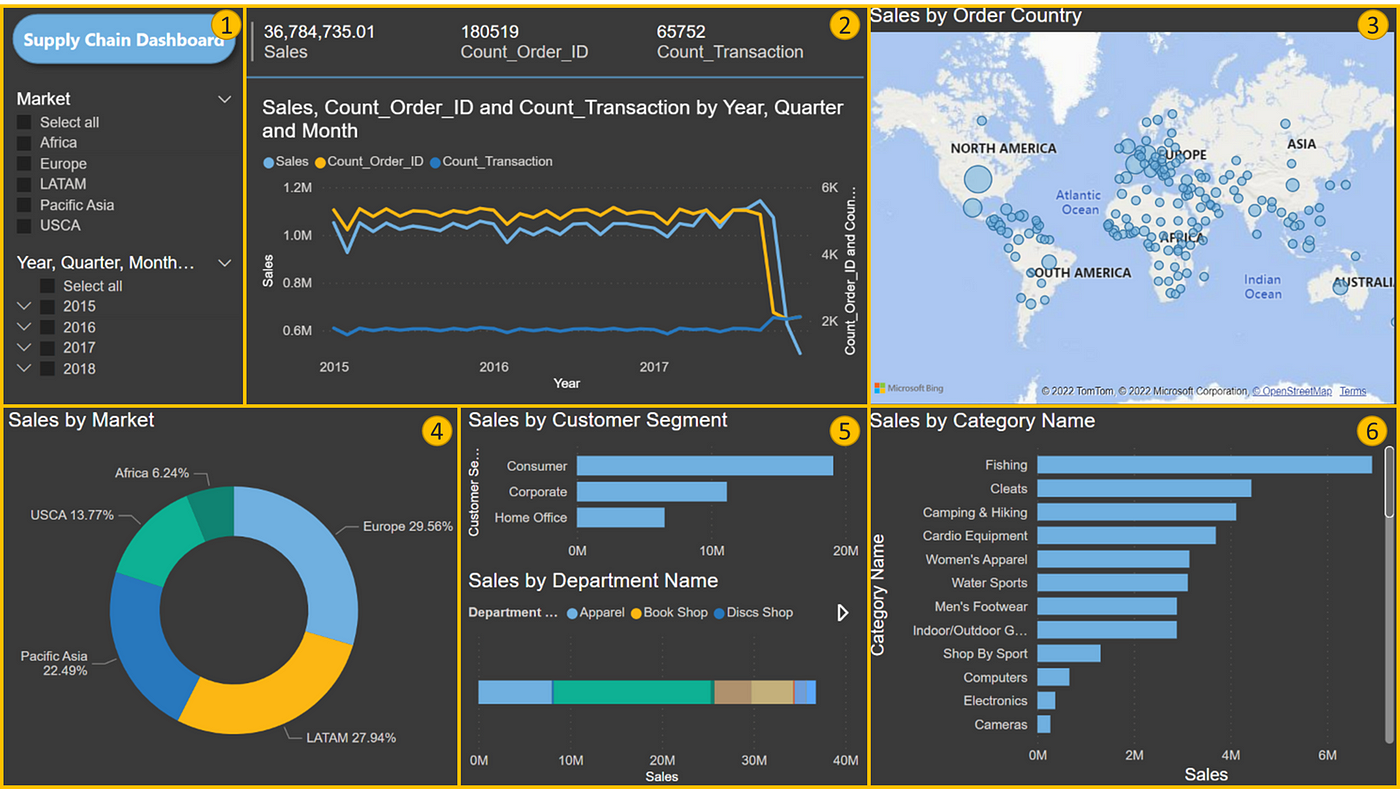
Let’s bring this all together with an example. Imagine you’re a supply chain analyst for a consumer goods company, and you’ve been tasked with creating a Power BI dashboard to monitor and improve your company’s supply chain performance.Your dashboard could include the following sections and visualizations:Overview:
- On-time delivery KPI gauge, showing the percentage of orders delivered on time.
- Inventory turnover ratio, presented as a bar chart with a target line.
- Map visualization showing the distribution of suppliers by region.
Order Management:
- Line chart tracking the trend of order volume over time, with a comparison to the previous period.
- Bar chart showing the breakdown of orders by product category.
- Drill-down capability to view order details, such as order quantity, value, and delivery status.
Inventory Management:
- Scatter plot visualizing the relationship between inventory levels and sales, with a trend line.
- Card visualization displaying the total value of inventory on hand.
- Drill-through page to view inventory details by product, location, and age.
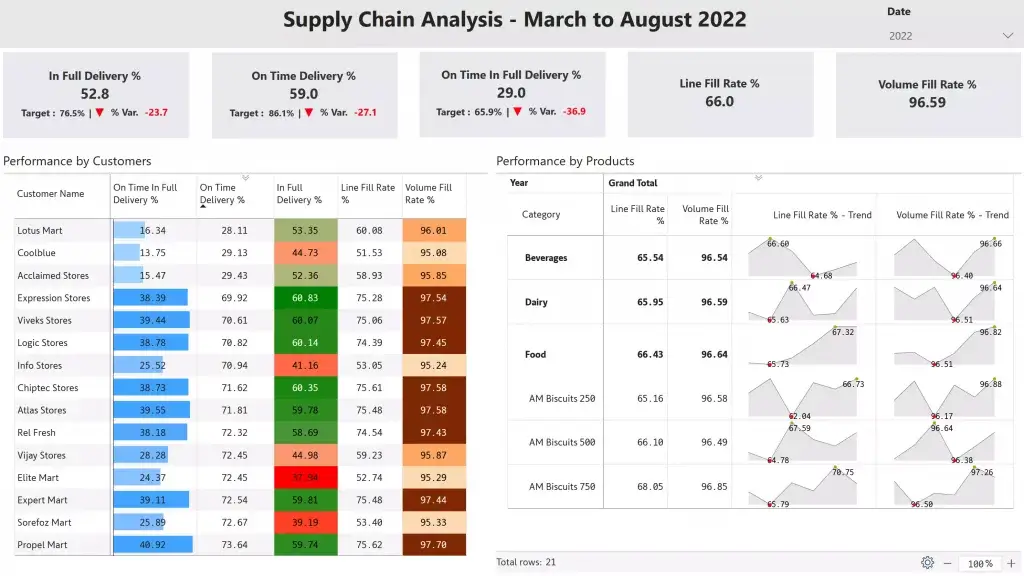
Supplier Performance:
- Table visualizing lead times by supplier, with color-coding to highlight suppliers meeting or exceeding targets.
- Donut chart showing the percentage of orders fulfilled by the top three suppliers.
- Ability to filter by supplier to compare performance across different KPIs.
Distribution and Logistics:
- Map visualization showing delivery routes and distribution centers.
- Card visualization displaying the average transportation cost per order.
- Line chart tracking transportation lead times over time.
By combining these sections and visualizations, you create a comprehensive supply chain dashboard that provides insights into various aspects of your operations, from order management and inventory control to supplier performance and logistics.
Streamlining Supply Chain Operations with Power BI
Building a supply chain dashboard with Power BI is just the first step. The real value comes from using the insights gained to streamline and optimize your supply chain operations. Here are some ways in which Power BI can help:
- Identifying bottlenecks: By monitoring KPIs and metrics in real time, you can quickly identify bottlenecks and inefficiencies in your supply chain. For example, you might notice that lead times are consistently higher for a particular supplier or that inventory levels are frequently low for a specific product.
- Improving inventory management: Power BI can help you optimize inventory levels by analyzing historical demand patterns, identifying seasonality, and forecasting future needs. This enables you to reduce excess inventory and minimize the risk of stockouts.
- Enhancing supplier management: The dashboard can provide insights into supplier performance, allowing you to identify suppliers who consistently meet delivery and quality targets. This information can be used to negotiate better terms, improve supplier relationships, and make more informed sourcing decisions.
- Optimizing distribution routes: Visualizing delivery routes and transportation data can help you optimize distribution networks, reduce transportation costs, and improve delivery times.
- Enabling data-driven decision-making: By providing a single source of truth and real-time data insights, Power BI empowers supply chain managers and executives to make informed decisions based on facts rather than intuition.
Conclusion
Building a supply chain dashboard with Power BI is a powerful way to streamline operations and improve performance. Through effective data visualization and analytics, organizations can gain valuable insights into their supply chain, identify areas for improvement, and make data-driven decisions.By following the step-by-step guide and best practices outlined in this article, you can create insightful and actionable supply chain dashboards that drive real business value. Remember to keep your dashboard simple, focused, and tailored to the specific needs of your organization and stakeholders.As you continue to leverage Power BI for supply chain analytics, regularly seek feedback from users and iterate on your dashboard design. What improvements have you noticed in your supply chain operations since implementing Power BI? How has data visualization impacted the way you manage and optimize your supply chain?