In today’s data-driven world, the ability to organize, understand, and extract insights from data is crucial for businesses to gain a competitive edge. This is where Power BI, a powerful business analytics tool, steps in, offering an extensive range of data modeling capabilities. By utilizing Power BI’s data modeling features, organizations can transform complex data into meaningful information, driving strategic decision-making and business success. In this comprehensive guide, we’ll take you on a journey through the world of data modeling in Power BI, covering everything from data import to transformation, and revealing the secrets to building robust and insightful data models.
What is Data Modeling in Power BI?
Data modeling in Power BI is the process of structuring and organizing data to create a meaningful representation of business information. It involves defining the relationships between different data entities, transforming raw data into valuable insights, and building a foundation for effective data analysis and visualization. With Power BI’s data modeling capabilities, organizations can unlock the power of their data, identify trends and patterns, and make data-driven decisions with confidence.
Why is Data Modeling Important?
Data modeling is an essential step in the data analysis process as it provides a structured framework for understanding data. It enables businesses to:
- Improve Data Understanding: By organizing data into logical structures, data modeling enhances the comprehension of data within an organization. This facilitates better decision-making, as stakeholders can easily interpret the information presented.
- Facilitate Data Consistency: A well-designed data model ensures consistency across an organization’s data assets. This consistency reduces confusion, streamlines data management, and enables seamless data integration from various sources.
- Enhance Data Quality: Data modeling encourages the identification and removal of data redundancies and inaccuracies. By defining clear relationships and applying transformation rules, data quality is improved, leading to more reliable insights.
- Support Data Governance: Effective data modeling aligns with data governance initiatives by defining data ownership, security, and privacy. This helps organizations comply with regulatory requirements and maintain data integrity.
- Drive Better Decision-Making: Ultimately, data modeling empowers businesses to leverage their data effectively. It enables stakeholders to explore data from multiple perspectives, identify patterns, and make informed decisions based on reliable insights.
Step-by-Step Guide to Data Modeling in Power BI
Now, let’s dive into the practical aspects of data modeling in Power BI, following a step-by-step process:
1. Importing Data into Power BI Desktop
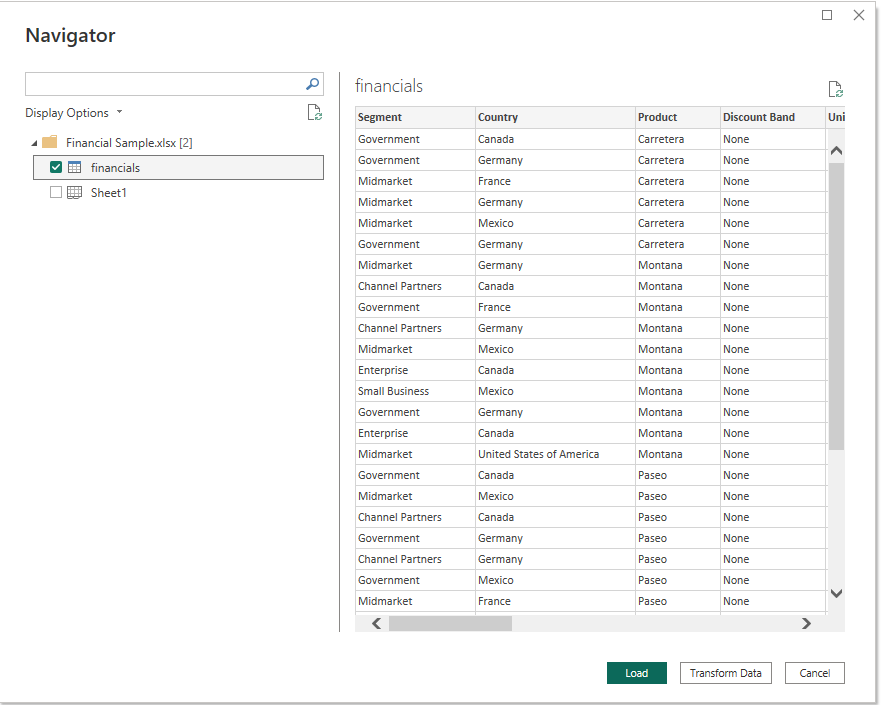
The first step in data modeling is importing your data into Power BI Desktop. Power BI supports a wide range of data sources, including Excel workbooks, CSV files, SQL databases, and cloud-based services like Azure and Amazon Redshift. To import data:
- Open Power BI Desktop and select “Get Data” from the Home ribbon.
- Choose the appropriate data source and navigate to your file or database.
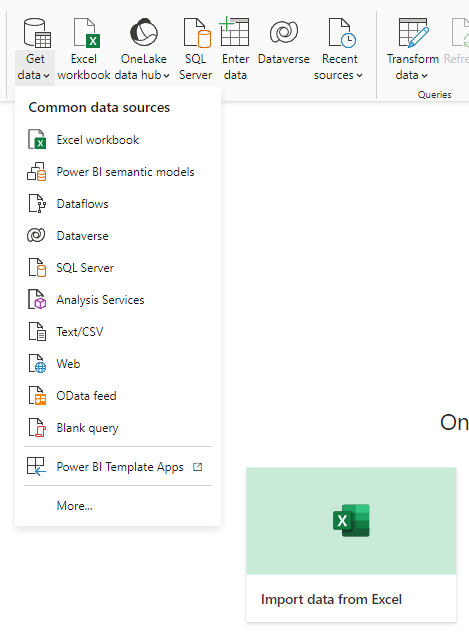
- Select the tables or ranges you want to import.
- Review the data preview and adjust any necessary settings, such as data type or formatting.
- Click “Load” to import the data into Power BI.
2. Cleaning and Transforming Data
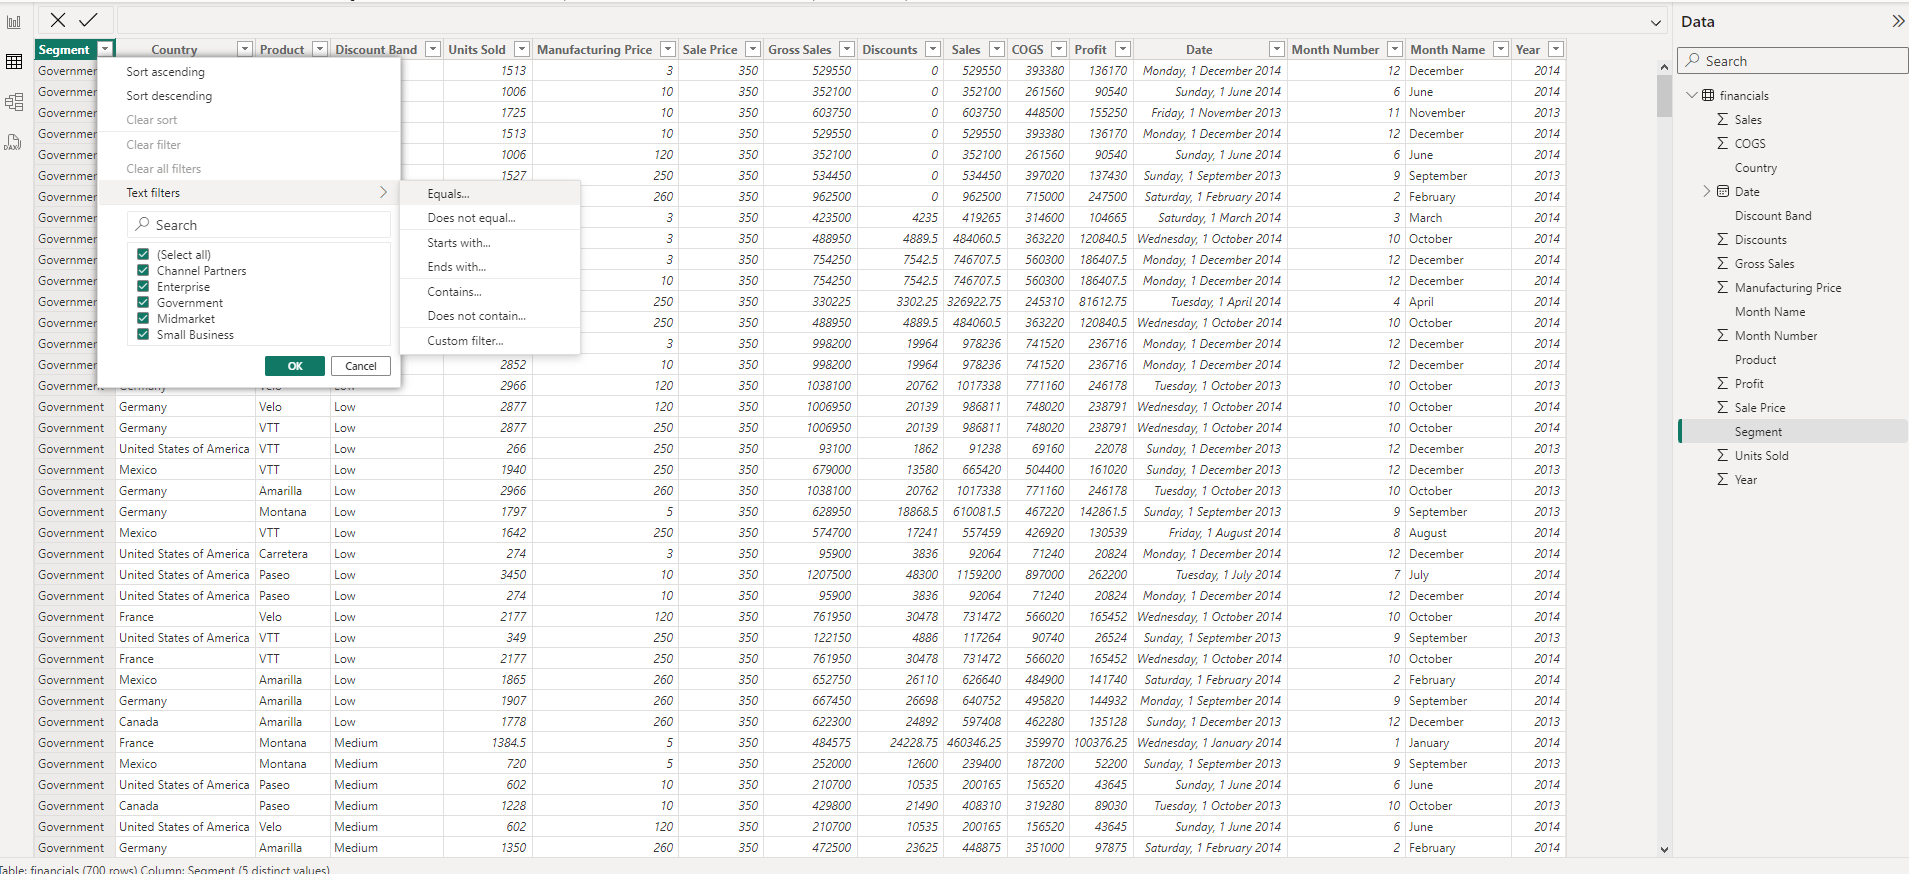
Once your data is imported, it’s crucial to clean and transform it to ensure accuracy and consistency. Power BI provides a range of data transformation tools:
- Select and Filter: Choose specific columns or rows to focus on relevant data.
- Rename: Provide meaningful names to tables and columns for easier understanding.
- Remove Duplicates: Identify and remove redundant data to ensure data integrity.
- Fill: Handle missing data by filling in values based on surrounding data.
- Replace Values: Correct or standardize data by replacing specific values.
- Format: Apply the appropriate data types and formatting to columns.
- Split Column: Divide a column into multiple columns for better organization.
- Merge Tables: Combine data from multiple tables based on common columns.
3. Creating Relationships Between Tables
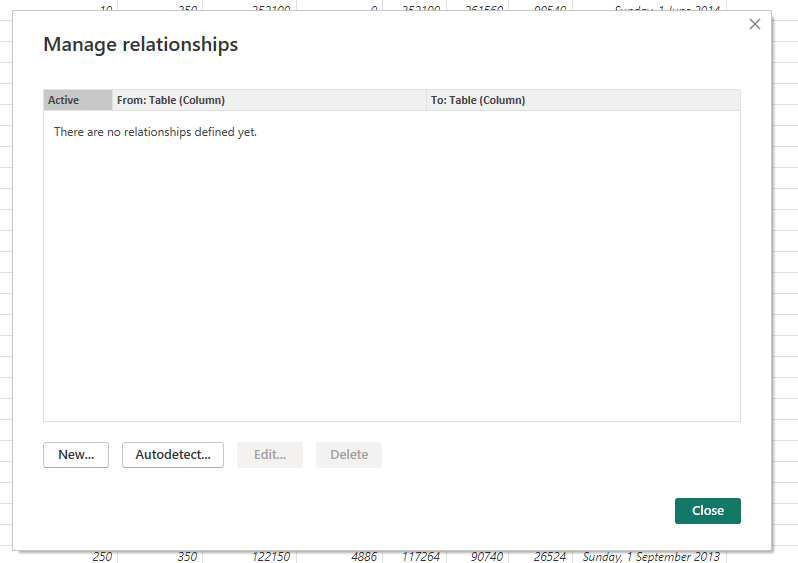
Defining relationships between tables is a fundamental aspect of data modeling. Relationships establish connections between related data entities:
- Select the “Model” ribbon and click “Manage Relationships.”
- Click “New” to create a new relationship.
- Choose the primary table and the related table.
- Select the primary key column from the primary table and the foreign key column from the related table.
- Set the cardinality of the relationship (one-to-one, one-to-many, or many-to-many).
- Optionally, you can set the cross-filter direction to control how filters are applied.
4. Enhancing Data with Calculated Columns and Measures
Power BI allows you to create calculated columns and measures to derive additional insights from your data:
- Calculated Columns: These are new columns derived from existing data. You can use DAX (Data Analysis Expressions) formulas to perform calculations and create new values.
- Measures: Measures are calculations that aggregate data, such as sums, averages, or percentages. They are dynamic and respond to changes in filters or slicers.

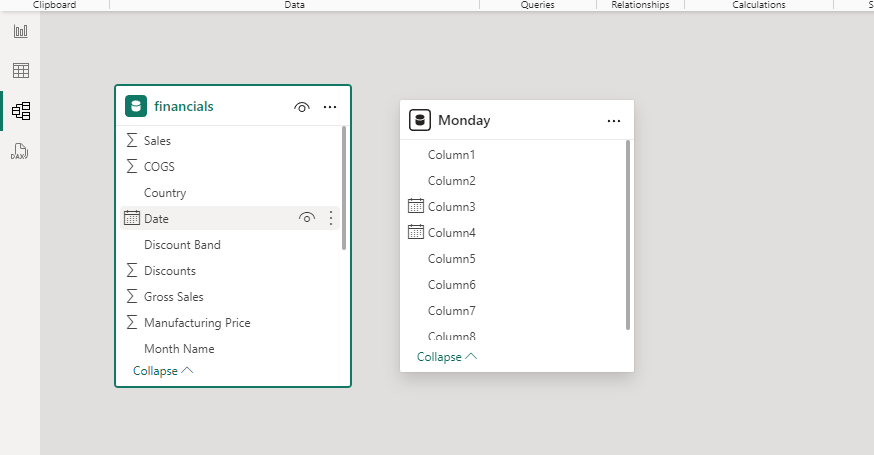
5. Designing a Data Model Diagram
Visualizing your data model through a diagram helps in understanding the relationships and structure:
- In the “Model” view, select “Diagram View.”
- Drag and rearrange tables to create a clear layout.
- Use color-coding or shapes to represent different types of tables or relationships.
- Add labels and annotations to explain complex relationships or business rules.
6. Optimizing Data Model Performance
Ensuring optimal data model performance is crucial for efficient reporting:
- Star Schema: Structure your data model using a star schema design, with dimensional tables surrounding a central fact table. This simplifies queries and improves performance.
- Indexing: Apply indexing to frequently queried columns to speed up data retrieval.
- Composite Models: Leverage composite models to combine data from direct query sources and imported data, optimizing performance for large datasets.
- Data Compression: Reduce the size of your data model by compressing large text fields or using data compression techniques.
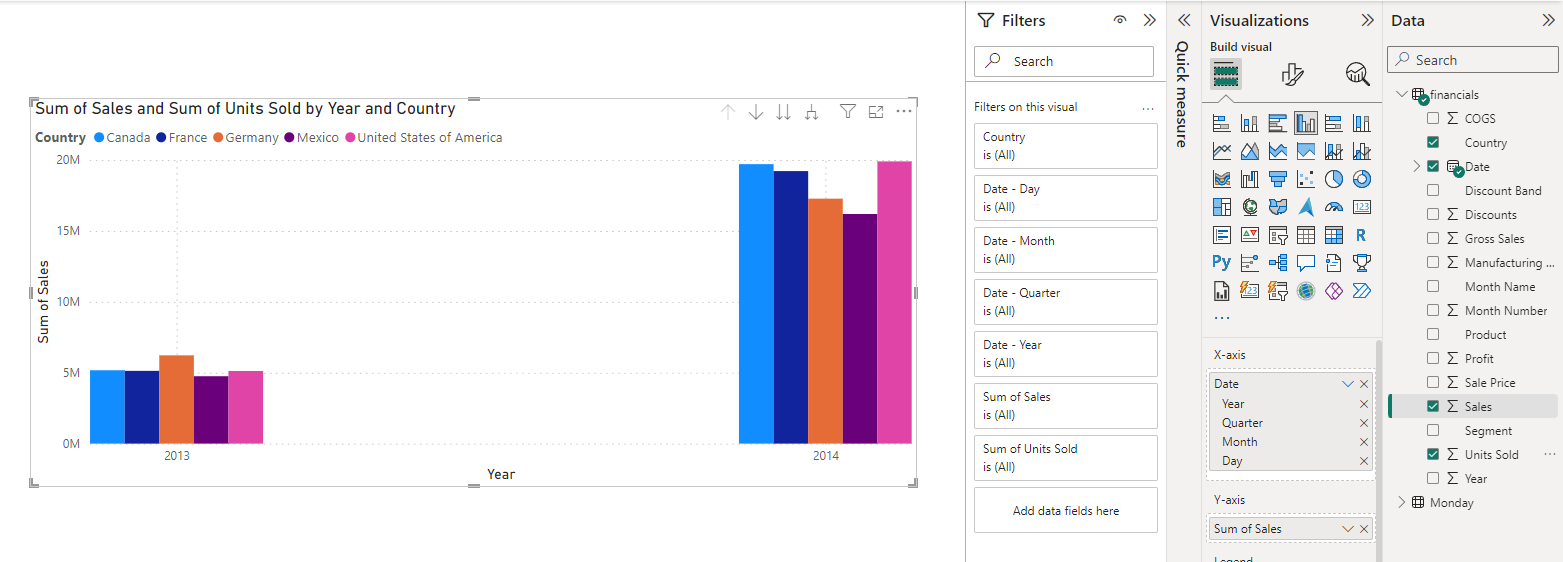
7. Visualizing Data with Interactive Reports
Power BI’s strength lies in its visualization capabilities. You can create interactive reports to explore and communicate insights:
- Switch to the “Report” view and select a visualization type (e.g., bar chart, line chart, map).
- Drag and drop fields onto the visualization to populate it with data.
- Apply filters, slicers, and drill-down options to allow users to explore the data.
- Enhance visuals with custom formatting, tooltips, and data labels.
- Use the “Pages” feature to organize related visuals into a cohesive story.
8. Sharing Insights with Dashboards
Dashboards provide a high-level overview of key metrics and KPIs:
- In the Power BI service, select “Dashboards” and choose “Create.”
- Add visuals from your reports by pinning them to the dashboard.
- Arrange and resize visuals to create a compelling layout.
- Use the “Q&A” feature to enable natural language queries and interactive exploration.
- Set data refresh schedules to keep dashboards up-to-date.
- Share dashboards with colleagues or external stakeholders, allowing them to monitor and explore the data.
Best Practices for Effective Data Modeling
To ensure the success of your data modeling efforts, consider the following best practices:
- Understand Business Requirements: Start by clearly defining the business objectives and requirements. This ensures that your data model aligns with the organization’s needs and provides valuable insights.
- Data Quality Assurance: Implement data quality checks and validation rules to maintain data accuracy and consistency. Regularly monitor and cleanse your data to identify and rectify issues.
- Documentation: Document your data model, including table structures, relationships, and business rules. This facilitates collaboration, maintenance, and knowledge transfer.
- Security and Governance: Implement appropriate security measures to protect sensitive data. Adhere to data governance policies and regulations to ensure data privacy and compliance.
- Iterative Development: Data modeling is an ongoing process. Embrace an iterative development approach, regularly reviewing and refining your data model based on user feedback and evolving business needs.
- Testing and Validation: Test your data model thoroughly to identify and address any issues. Validate the accuracy of calculations, measures, and relationships to ensure reliable insights.
- Data Modeling Standards: Establish data modeling standards and naming conventions within your organization. Consistency in table structures, relationships, and formulas improves collaboration and understanding.
- User Training and Support: Provide training and support to users to help them effectively utilize the data model and associated reports and dashboards. This empowers users to extract maximum value from the tools and insights provided.
Real-World Use Cases of Power BI Data Modeling
Data modeling in Power BI has been leveraged across various industries to drive impactful decisions:
- Retail: Retailers use Power BI to analyze sales data, customer behavior, and market trends. By modeling data from multiple sources, they can optimize pricing, inventory management, and marketing campaigns, ultimately enhancing the customer experience.
- Healthcare: Healthcare organizations use Power BI to track patient outcomes, identify patterns in treatment effectiveness, and monitor resource utilization. Data modeling enables them to improve patient care, reduce costs, and make informed policy decisions.
- Finance: Financial institutions leverage Power BI to analyze market trends, manage investment portfolios, and assess risk. Data modeling helps them consolidate data from various sources, ensuring compliance and enabling data-driven investment strategies.
- Manufacturing: Power BI is used in manufacturing to monitor production processes, optimize supply chains, and analyze product quality. Data modeling allows manufacturers to identify inefficiencies, improve productivity, and enhance overall operational excellence.
Conclusion: Unlocking the Power of Your Data
Effective data modeling in Power BI is a transformative skill that empowers organizations to harness the full potential of their data. By following the steps outlined in this guide, businesses can structure, analyze, and visualize their data with confidence, leading to strategic insights and competitive advantages. As data continues to play a pivotal role in decision-making, Power BI’s data modeling capabilities will remain a cornerstone for organizations seeking to unlock the power of their data. How has your organization utilized data modeling in Power BI to gain valuable insights? What challenges did you face, and what best practices would you recommend to others embarking on their data modeling journey? Share your experiences and insights in the comments below!