In the world of data analytics, few tools are as powerful and versatile as Power BI. With its robust features and user-friendly interface, creating insightful dashboards and reports has become accessible to a broad audience. However, to truly unlock the potential of Power BI, it’s essential to delve into the realm of advanced interactivity. This article will take you on a comprehensive journey, exploring the implementation of drilldowns, filters, and other interactive features to create dynamic and engaging dashboards that empower users with actionable insights.
Understanding the Importance of Advanced Interactivity
Before diving into the technical aspects, let’s take a step back to appreciate the significance of advanced interactivity in dashboard design. Interactivity is a game-changer when it comes to data exploration and analysis. It empowers users to go beyond passive observation and actively engage with the data, following their own paths of inquiry.Here are some key advantages of advanced interactivity:
- Empowering Users: Advanced interactivity puts the power in the hands of your dashboard users. They can tailor their exploration to specific areas of interest, ask their own questions, and seek answers directly from the data. This level of autonomy enhances user engagement and fosters a deeper understanding of the insights presented.
- Facilitating Drill-Down Analysis: Drilldowns allow users to peel back the layers of aggregated data, revealing underlying details. This capability is invaluable when users want to explore specific data points, identify trends, or investigate anomalies. It provides a more nuanced perspective, helping users make more informed decisions.
- Contextual Insights: Interactive features, such as filters, enable users to narrow down their focus to specific segments or time periods. This facilitates context-rich analysis, allowing users to identify patterns or relationships that might otherwise be obscured in the overall dataset. Contextual insights are particularly valuable in uncovering actionable information.
- Dynamic Storytelling: Interactivity adds a narrative dimension to your dashboards. Users can navigate through different views, uncovering insights and connections as they explore. This dynamic storytelling approach makes data interpretation more intuitive and memorable, enhancing the overall user experience.
- Flexible Decision-Making: By providing users with the ability to interact and manipulate data, advanced interactivity supports more agile decision-making. Users can quickly test hypotheses, assess different scenarios, and consider alternative strategies based on real-time data exploration.
Implementing Drilldowns in Power BI
Drilldowns are a fundamental aspect of advanced interactivity, allowing users to explore data at varying levels of granularity. Power BI provides several ways to implement drilldowns, each offering a unique user experience.
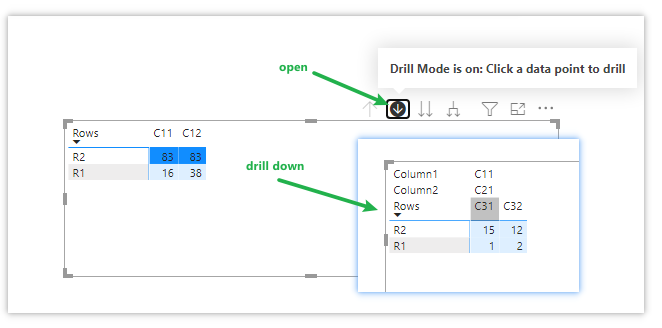
Basic Drilldown
The most straightforward drilldown enables users to move between different levels of a hierarchy. For instance, you might have a bar chart displaying sales by country, and users can drill down to view sales at the state or city level.Example: Let’s say you have a report on global retail sales with a hierarchy of Continents > Countries > Cities. You can create a basic drilldown on a map visualization by right-clicking on the data field (e.g., “Country”) and selecting “Drill Down” or “Drill Down Group.” This will add a drilldown icon to the visualization, allowing users to explore sales performance at a more granular level.
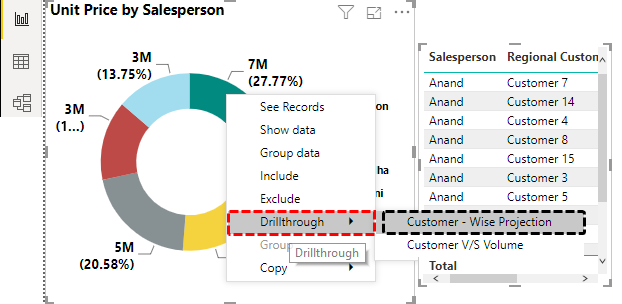
Drillthrough
Drillthrough provides a more guided exploration experience. With this feature, users can click on a data point and be taken to a separate page that provides additional details related to their selection.Example: Consider a dashboard that summarizes sales performance across different product categories. By enabling drillthrough on a category column, users can click on a specific category and be directed to a dedicated page showing detailed sales metrics for that particular category, including sales over time, top-selling products, and regional performance.To set this up, create a new page for the detailed view and add the desired visuals. Then, select the column you want to use for drillthrough and choose “Manage Drillthrough” from the context menu. On the “Drillthrough” pane, specify the destination page and select the fields you want to pass through to the detailed view.
Custom Drilldown Actions
For even more flexibility, you can create custom drilldown actions using DAX measures and buttons. This approach allows you to define specific interactions and navigate to particular pages or sections of your report based on user selections.Example: Imagine you have a report analyzing customer churn for a subscription-based service. You can create a custom drilldown action to explore churn reasons in more detail. First, create a DAX measure that returns the churn reason based on a selected customer ID. Then, add a button to your report and set its action to “Go to a page in this report.” When configuring the action, dynamically reference the page name using the DAX measure. This way, when a user clicks on the button, they are taken to a page that provides insights into the selected customer’s churn reasons.
Enhancing Dashboards with Filters
Filters are a pivotal tool in Power BI for refining data and facilitating focused analysis. They enable users to isolate specific segments, time periods, or dimensions, revealing nuanced insights that might otherwise be hidden.
Basic Filtering
Power BI offers a range of basic filtering options that can be applied directly to visuals. These include simple filters, where users select specific values or use sliders to define ranges, as well as advanced filters that support more complex conditions.Example: On a line chart visualizing sales over time, you can add a basic filter to the “Year” field. This allows users to select a specific year and focus on sales data for that particular time period.
Cross-Highlighting and Slicers
Cross-highlighting and slicers are powerful tools for applying filters across multiple visuals simultaneously. Cross-highlighting lets users select data points on one visual to highlight corresponding data on other visuals. Slicers, on the other hand, provide dedicated filtering interfaces that users can interact with to narrow down their focus.Example: You have a dashboard with multiple visuals analyzing sales performance, including a map, a bar chart, and a table. By enabling cross-highlighting, users can click on a specific region on the map, and the bar chart and table will update to display sales data for that region only. Alternatively, you can add a slicer for the “Region” field, allowing users to select multiple regions to compare sales across them.
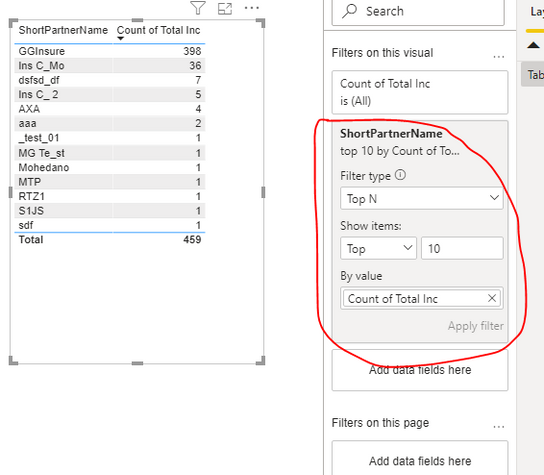
Top N and Relative Date Filters
Power BI also offers dynamic filtering options, such as Top N and relative date filters. Top N filters allow users to focus on the top (or bottom) performing values, which is particularly useful when dealing with large datasets. Relative date filters automatically update based on the current date, making it easy to analyze recent data.
Example: For a report on monthly website traffic, you can add a relative date filter to the “Date” field, selecting “Last 30 days.” This ensures that users always see the most recent month’s data without needing to manually adjust the filter range.
Incorporating Additional Interactivity
Beyond drilldowns and filters, Power BI provides a host of other interactive features to enhance your dashboards.
Bookmarks and Buttons
Bookmarks capture the state of visuals and filters on a page, allowing users to quickly switch between different views. Buttons, on the other hand, can be used to trigger specific actions, such as navigating to different pages or showing/hiding specific visuals.Example: You’ve created a dashboard with multiple views, each showcasing a different aspect of customer behavior. By using bookmarks, users can easily toggle between these views, focusing on the insights that interest them the most. Buttons can be added to provide a clear call to action, such as resetting filters or navigating to supplementary information.
Tooltips and Cards
Tooltips provide additional context when users hover over data points, while cards offer a concise summary of key metrics. Both features can be enhanced with interactive elements to provide a richer user experience.Example: On a scatter plot visualizing customer satisfaction ratings, you can customize the tooltips to include interactive elements like buttons or dropdowns. This allows users to take immediate action based on the information presented, such as drilling down to see feedback for a specific product or comparing ratings across different segments.
Sync Slicers and Drillthrough Interactions
Sync slicers allow you to apply filters across multiple pages, ensuring consistency throughout your report. Drillthrough interactions, as mentioned earlier, enable users to explore additional details related to their selections.Example: You have a report with multiple pages analyzing sales data by region. By using sync slicers, users can select a specific region on one page, and the filters will be applied across all other pages, providing a seamless exploration experience. Drillthrough interactions can be added to visuals, allowing users to click on a data point and be taken to a page with more detailed information, such as sales trends, top products, and customer demographics for the selected region.
Best Practices and Design Considerations
When implementing advanced interactivity in Power BI, it’s important to keep certain design principles in mind to ensure a seamless and intuitive user experience.
- Clarity and Consistency: Ensure that interactive elements are clearly labeled and that their functionality is consistent throughout the dashboard. This minimizes user confusion and promotes a smooth exploration process.
- Visual Hierarchy: Establish a visual hierarchy that guides users toward the most important interactive elements. Use size, color, and placement to draw attention to key features, making sure they stand out from less critical components.
- Feedback and Responsiveness: Provide immediate feedback to users when they interact with the dashboard. This can be in the form of visual cues, animations, or loading indicators. Responsiveness is key to keeping users engaged and satisfied.
- Contextual Tooltips: Enhance tooltips with additional information or interactive elements to provide users with context and guidance. This helps users understand the data and make the most of the interactive features.
- Mobile Optimization: Consider how your dashboard will be used on different devices, especially mobile platforms. Ensure that interactive elements are touch-friendly and that the layout adapts well to smaller screens.
- Performance Optimization: Advanced interactivity can be demanding on system resources. Optimize your report by using efficient DAX formulas, reducing unnecessary data, and leveraging Power BI’s performance tuning features to ensure a smooth and responsive user experience.
Conclusion and Reflection
Advanced interactivity in Power BI transforms dashboards from static displays into dynamic exploration tools. By implementing drilldowns, filters, and other interactive features, you empower users to actively engage with data, uncover insights, and make data-driven decisions with confidence.As you incorporate these techniques into your own Power BI projects, reflect on the following questions:
- How can advanced interactivity support the specific analytical needs of your audience?
- What types of drilldowns and filters would be most beneficial for exploring your data?
- How can you strike a balance between providing sufficient interactive functionality and maintaining a clean, uncluttered dashboard design?
- Are there opportunities to leverage custom visuals or DAX measures to create unique and tailored interactive experiences?
- How might you use bookmarks, buttons, and sync slicers to guide users through a narrative journey within your dashboard?
By considering these questions and applying the techniques outlined in this article, you’ll be well on your way to creating stunning and highly interactive Power BI dashboards that deliver exceptional insights and value to your users.What are your thoughts on advanced dashboard interactivity? Do you have any additional tips or success stories to share? Feel free to leave a comment and join the discussion!