Power BI provides an extensive feature set for data modeling, visualization, and analysis, catering to a wide range of users and use cases. However, there are situations where you might find yourself needing more specialized or advanced functionalities:
- Advanced Statistical Analysis: While Power BI offers basic statistical functions, more complex statistical modeling or machine learning applications may require external tools. For instance, you might want to use R or Python scripts for advanced analytics.
- Custom Visualizations: Power BI has a rich library of built-in visuals, but for truly unique and customized visuals, you might need to look beyond the standard offerings. External tools can help create bespoke visualizations that perfectly match your branding or specific data presentation needs.
- Complex Data Transformations: Power BI’s Power Query offers robust data transformation capabilities. Yet, for very intricate data preparation tasks, external tools like Alteryx or Knime can provide a more comprehensive set of features.
- Specific Data Connectors: Power BI supports connections to a vast array of data sources. However, if you need to connect to a niche or proprietary data source, external tools might be required to facilitate that connection.
- Extended Report Functionality: While Power BI reports are interactive, external tools can add further interactivity or specific functionality. For example, you might want to integrate a mapping tool for advanced geographic analysis or a third-party tool for drill-through actions.
Types of External Tools for Power BI
External tools for Power BI can be broadly categorized into a few types, each serving distinct purposes:
- Data Preparation Tools: These tools help in advanced data cleaning, transformation, and preparation tasks. Examples include Alteryx, Knime, and Trifacta.
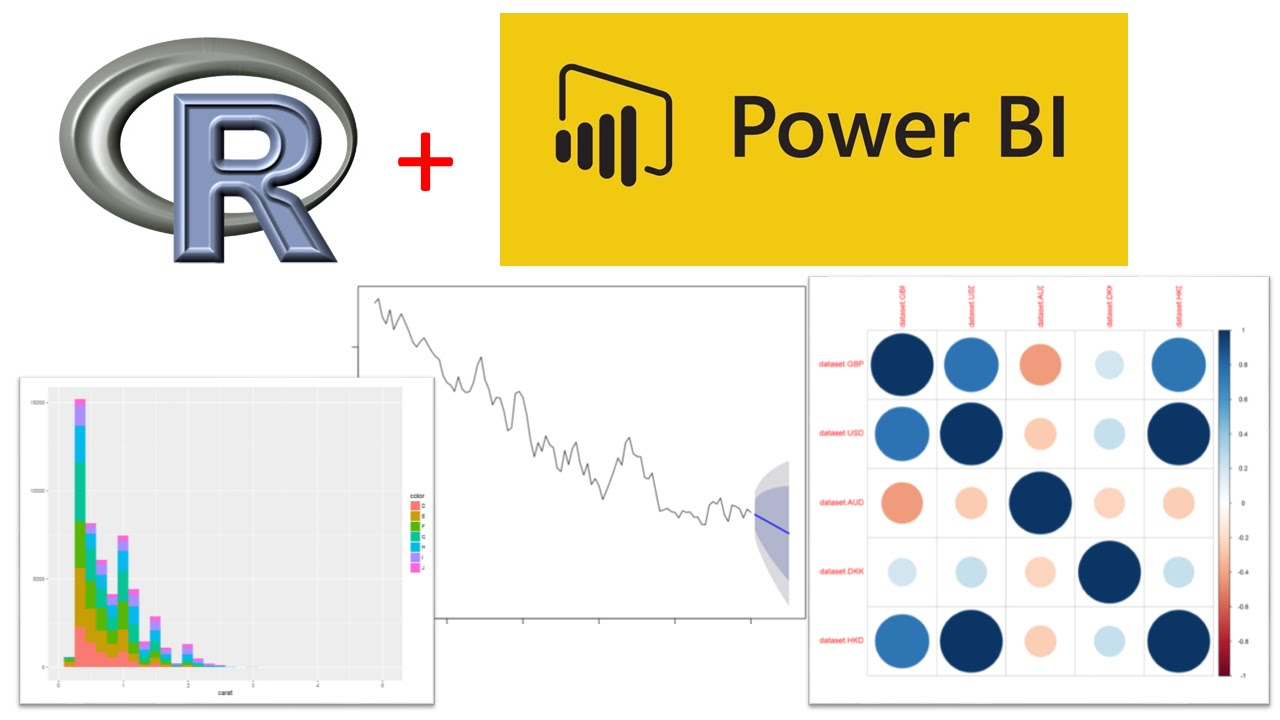
- Statistical and ML Tools: Offering advanced statistical and machine learning capabilities, these tools integrate with Power BI to provide predictive analytics and data modeling. R and Python are commonly used in this category.
- Data Connectors: Facilitating connections to niche or proprietary data sources, these tools enable Power BI to access data from less common platforms or legacy systems. Examples include CData connectors or custom-built connectors.
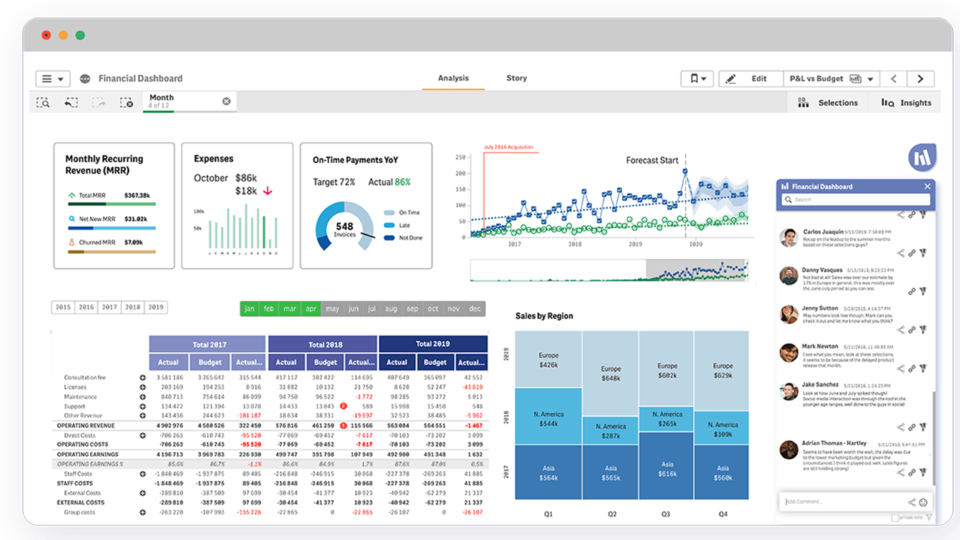
- Visualization Tools: Providing unique and custom visualization options, these tools help create bespoke visuals for specific reporting needs. Examples include Vizlib, Playfair Data, or custom visuals built with D3.js.
- Report Enhancement Tools: These tools add extended functionality to Power BI reports, such as advanced mapping, drill-through actions, or custom report tooltips. Examples include the Mapbox mapping tool or Drillthrough URLs.
Step-by-Step Guide to Integrating External Tools
Now that we’ve explored the types of external tools available, let’s dive into a step-by-step guide on how to integrate them with Power BI. We’ll cover the process for each category of tools mentioned earlier.
Step 1: Data Preparation Tools Integration
Data preparation tools help streamline the data transformation process, especially for complex tasks. Here’s how you can integrate them with Power BI:
- Identify the Need: Assess your data preparation requirements. If you have intricate data cleansing, transformation, or advanced data blending needs, a data preparation tool might be beneficial.
- Choose a Tool: Select a data preparation tool that suits your requirements. Popular options include Alteryx, Knime, and Trifacta. Consider factors like ease of use, available transformations, and integration options with Power BI.
- Prepare the Data: Use the chosen tool to clean, transform, and prepare your data. This might involve creating a data flow or a set of transformation rules specific to your data.
- Connect to Power BI: Once your data is prepared, connect it to Power BI. Most data preparation tools offer direct connectors or output options that can be easily imported into Power BI.
- Model and Visualize: With the transformed data in Power BI, continue with your data modeling and visualization process as usual. The prepared data should now be easier to work with and ready for in-depth analysis.
Example: Alteryx and Power BI Integration
Alteryx is a powerful data preparation tool that offers a wide range of data transformation functions. Here’s a simplified example of how Alteryx can be used to prepare data for Power BI:
- In Alteryx, create a new workflow and connect to your data source, which could be a database, CSV file, or even an Excel spreadsheet.
- Use Alteryx’s intuitive interface to perform data cleansing tasks, such as removing duplicates, handling missing values, and standardizing data formats.
- Apply more complex transformations like data parsing, pivoting, or advanced calculations to restructure and derive insights from your data.
- Output the transformed data to a format that Power BI can read, such as a CSV file or a database table.
- In Power BI, connect to the prepared data and build your data model and visualizations as usual.
Step 2: Statistical and ML Tools Integration
For advanced statistical analysis and machine learning applications, external tools can be leveraged within Power BI:
- Identify Use Case: Determine the specific advanced analytics need. This could be predictive modeling, clustering, or more complex statistical analyses.
- Choose a Tool: Select an appropriate statistical or ML tool. R or Python are popular choices due to their extensive libraries and community support. Consider the specific libraries or packages required for your use case.
- Prepare the Environment: Ensure that the chosen tool can integrate with Power BI. For R or Python, you’ll need to install the necessary components, like RStudio or Anaconda, and configure the Power BI environment to recognize the tools.
- Develop the Model: Using the chosen tool, develop your statistical model or machine learning algorithm. This might involve data preparation, feature engineering, and model training.
- Integrate with Power BI: Once your model is ready, integrate it with Power BI. You can do this by using the “Execute R Script” or “Execute Python Script” functions within Power BI Desktop, or by deploying your model to a platform that Power BI can connect to, such as Azure Machine Learning.
Example: R Integration with Power BI
Here’s a simplified example of how R can be integrated with Power BI to perform a clustering analysis:
- Install R and RStudio on your machine, and ensure that the R integration is enabled in Power BI Desktop options.
- In RStudio, load the necessary libraries for clustering, such as “factoextra” and “fpc.”
- Prepare your data for clustering by scaling or normalizing variables, if required.
- Apply a clustering algorithm, such as k-means or hierarchical clustering, to your data and visualize the results using R’s plotting functions.
- In Power BI Desktop, connect to your data source and load the necessary fields for clustering.
- Use the “Execute R Script” function in Power BI to call your R code and perform the clustering analysis directly within Power BI.
- Visualize the results in Power BI using scatter plots or other appropriate visuals to showcase the clusters.
Step 3: Data Connector Integration
To connect Power BI to niche or proprietary data sources, external data connectors can be utilized:
- Identify the Data Source: Determine the specific data source you need to connect to. This could be a legacy system, a niche SaaS platform, or a custom database.
- Find a Connector: Research and locate a suitable data connector for your data source. This might involve searching for third-party connectors or checking if the data source provider offers a custom connector.
- Install and Configure: Install and set up the connector according to the provided instructions. This might involve downloading and installing a driver or configuring connection settings.
- Connect in Power BI: Once the connector is set up, launch Power BI Desktop and navigate to the “Get Data” section. Locate and select the installed connector from the list of data sources.
- Access the Data: Follow the connection prompts to provide the necessary credentials or connection details. Ensure that you have the appropriate access rights to the data source.
- Model and Visualize: With the data now accessible in Power BI, proceed to build your data model and create meaningful visualizations as usual.
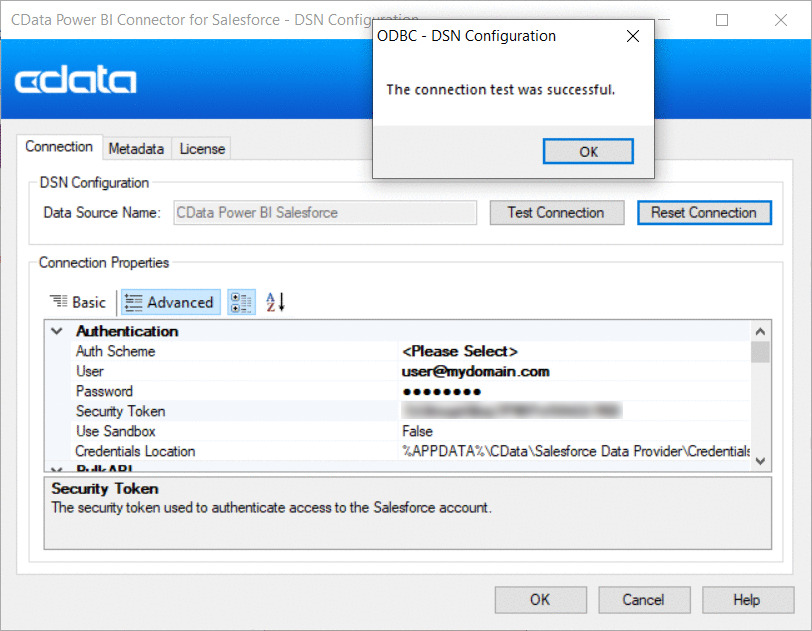
Example: CData Connectors
CData offers a wide range of data connectors for various data sources, including niche platforms. Here’s an example of how to use a CData connector to connect Power BI to Zendesk, a customer support platform:
- Download and install the CData Power BI Connector for Zendesk from the CData website.
- Launch Power BI Desktop and select “Get Data” > “More…” > “Other,” and locate the CData connector from the list.
- In the connection wizard, provide your Zendesk account details, including your subdomain, username, and API token.
- Select the Zendesk objects you want to import into Power BI, such as Tickets, Users, or Organizations.
- Load the data into Power BI and start building your reports and dashboards based on Zendesk data.

Step 4: Visualization Tools Integration
For unique and custom visualization needs, external visualization tools can be leveraged:
- Identify Visualization Need: Determine the specific visualization requirement. This could be a need for bespoke visuals, advanced mapping capabilities, or interactive charts.
- Choose a Visualization Tool: Select a visualization tool that suits your needs. This could be a third-party tool like Vizlib or Playfair Data, or a custom visual built using D3.js or a similar library.
- Install and Configure: If using a third-party tool, install and set up the tool according to the provided instructions. This might involve downloading custom visual files or registering the tool with Power BI.
- Design Custom Visuals: Use the chosen tool to design and build your custom visuals. This could involve configuring visual properties, data mappings, and interactivity options.
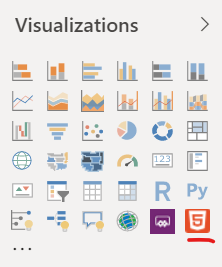
- Integrate with Power BI: Once your custom visuals are ready, integrate them with Power BI. This could be done by importing custom visual files or by using the “Import Custom Visual” option in Power BI Desktop.
Example: Vizlib Custom Visuals
Vizlib offers a range of custom visuals for Power BI, providing unique and advanced visualization options. Here’s how you can use Vizlib to enhance your Power BI reports:
- Download and install the Vizlib Library, which includes a collection of custom visuals.
- Launch Power BI Desktop and navigate to the “Options and Settings” menu. In the “Custom Visuals” section, ensure that the “Allow custom visuals from additional marketplaces” option is enabled.
- Restart Power BI Desktop and locate the Vizlib visuals in the “Vizlib Library” section of the visuals pane.
- Select the desired Vizlib visual, such as the “Bar Chart with Variance” or “Heatmap with Labels,” and add it to your report canvas.
- Configure the visual by mapping the appropriate data fields and customizing the visual properties to match your requirements.
Step 5: Report Enhancement Tools Integration
To add extended functionality to your Power BI reports, you can integrate report enhancement tools:
- Identify Report Enhancement Need: Assess your reporting requirements. This could be a need for advanced mapping capabilities, drill-through actions to external systems, or custom report tooltips.
- Choose a Report Enhancement Tool: Select a tool that addresses your specific need. This could be a mapping tool like Mapbox, a URL action tool for drill-throughs, or a custom development solution.
- Install and Configure: If the tool requires installation, set it up according to the provided instructions. This might involve registering for an API key or configuring connection settings.
- Integrate with Power BI: Utilize the chosen tool to enhance your Power BI report. This could involve using custom visual tools, configuring URL actions, or developing custom report elements using Power BI’s APIs.
Example: Mapbox Integration for Advanced Mapping
Mapbox is a powerful mapping tool that can be integrated with Power BI to provide advanced geographic analysis capabilities:
- Sign up for a Mapbox account and create a new access token, which will be used to authenticate your Power BI reports.
- In Power BI Desktop, install the Mapbox custom visual from the marketplace.
- On the report canvas, add the Mapbox visual and configure the map settings, including the map style, center, and zoom level.
- Connect your location data to the Mapbox visual by mapping the appropriate latitude and longitude fields.
- Customize the map markers, add pop-up information, and apply any desired map filters or drill-down options.
- Publish your report to the Power BI service, ensuring that you have the Mapbox access token configured in the data source settings.
Best Practices and Tips
When integrating external tools with Power BI, it’s important to keep the following best practices and tips in mind:
- Assess Your Needs: Before embarking on external tool integration, thoroughly assess your requirements. Ensure that the external tool addresses a specific need and provides value to your analysis or reporting process.
- Data Security: When working with external tools, especially those that connect to data sources, always consider data security. Ensure that the tools and connectors you use adhere to your organization’s data security policies and industry standards.
- Performance Impact: Some external tools, especially those involved in data preparation or advanced analytics, can impact the performance of your Power BI reports. Test and optimize your reports to ensure they remain responsive and efficient.
- Documentation: Properly document the integration process, including the steps taken, configurations made, and any customization applied. This will help with troubleshooting and maintaining the solution over time.
- User Training: If the integration involves custom visuals or enhanced report functionality, ensure that end-users are properly trained. This will help them understand how to interpret and interact with the reports effectively.
- Keep Up to Date: Stay informed about updates to both Power BI and the external tools you’re using. This will help you leverage new features and ensure compatibility as the tools evolve.
Conclusion and Future Exploration
Integrating external tools with Power BI opens up a world of advanced analysis and reporting capabilities, enabling users to go beyond the standard feature set. In this article, we’ve explored the reasons for using external tools, the types of tools available, and provided step-by-step guides to integrating them with Power BI. Along the way, we’ve offered best practices and examples to ensure a seamless implementation.There is a vast array of external tools available, and the possibilities for extending Power BI’s capabilities are endless. As you continue on your Power BI journey, consider exploring additional tools and integrations to unlock even more insights from your data.What external tools have you used or plan to use with Power BI? How have they enhanced your data analysis and reporting capabilities?
Pingback: Unlocking Business Intelligence: A Comprehensive Guide to Power BI Licensing - Master your Data with PowerBI