Data preparation is an essential step in any data analysis process, and it plays a particularly crucial role in the success of Power BI dashboards and reports. This comprehensive guide will take you through the ins and outs of creating and managing dataflows, a powerful feature in Power BI that simplifies and streamlines data preparation. By the end, you should be well-equipped to tackle common data preparation challenges and create robust and efficient dataflows for your Power BI solutions.
Understanding Dataflows: The What and Why
Dataflows are the backbone of Power BI’s data preparation capabilities. At a high level, a dataflow is a collection of entities that define the structure and logic for ingesting, transforming, and storing data in Azure Data Lake Storage Gen2. It provides a no-code/low-code environment for users to shape and refine data before loading it into Power BI models.The key components of a dataflow include:
- Data Sources: These are the connectors to various data sources such as Excel files, databases, web services, and more, from which data is ingested.
- Entities: Entities are similar to tables in a database. They define the structure and schema of the data, including the columns, data types, and relationships between different sets of data.
- Transformations: Dataflows offer a wide range of transformations to clean, transform, and enrich data. These include filtering, sorting, renaming columns, and more complex operations like pivoting and unpivoting tables.
- Data Storage: Dataflows store the prepared data in Azure Data Lake Storage Gen2, providing a scalable and secure data storage solution.
So, why use dataflows? Here are some key benefits:
- Simplified Data Preparation: Dataflows provide a user-friendly interface for data preparation, reducing the need for complex coding or scripting. This makes it accessible to a wider range of users, from business analysts to data scientists.
- Centralized Data Management: By storing data in Azure Data Lake Storage Gen2, dataflows offer a centralized and secure location for all your data. This simplifies data governance and ensures data consistency across the organization.
- Data Refresh and Scheduling: Dataflows support data refresh schedules, ensuring that your reports and dashboards always display the latest data.
- Enhanced Data Modeling: The structured nature of dataflows, with defined entities and relationships, improves the data modeling process, resulting in more efficient and performant Power BI models.
- Reusability: Dataflows can be reused across multiple Power BI reports and dashboards, reducing redundant data preparation efforts.
Step-by-Step Guide to Creating and Managing Dataflows
Now, let’s dive into the practical aspects of creating and managing dataflows. We’ll walk through the end-to-end process, covering everything from setting up your environment to advanced data transformation techniques.
Step 1: Setting Up Your Environment
Before you begin creating dataflows, ensure that you have the necessary permissions and that your environment is properly configured:
- Permissions: You’ll need the appropriate licenses and permissions to create and manage dataflows. Ensure you have a Power BI Pro license and the appropriate workspace permissions.
- Workspace Configuration: Dataflows are created and managed within Power BI workspaces. Ensure that you have a dedicated workspace for your dataflows, and that the workspace is configured to use Azure Data Lake Storage Gen2.
- Data Source Access: Ensure that you have the necessary credentials and access rights to connect to your data sources.
Step 2: Ingesting Data
The first step in creating a dataflow is to ingest data from one or more sources. Power BI provides a wide range of data connectors to facilitate this process:
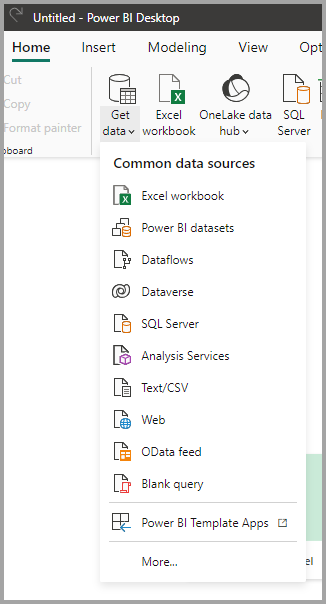
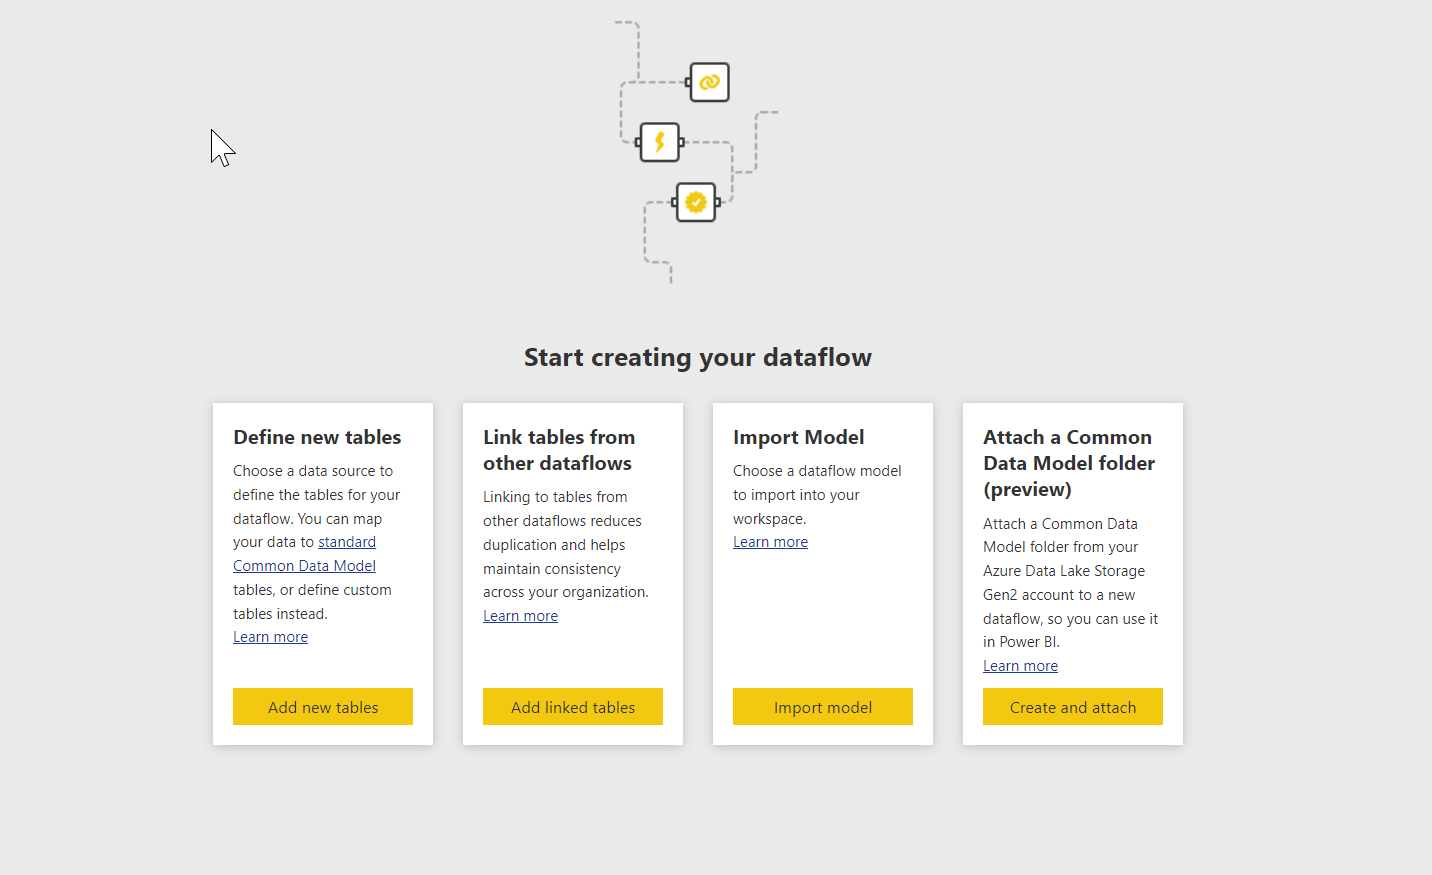
- Launch Dataflow Creation: In your Power BI workspace, select “Create” > “Dataflow” to launch the dataflow creation interface.
- Choose Data Source: Select the appropriate data connector from the list of available sources. Common sources include Excel files, CSV files, SQL databases, and web services like SharePoint or Dynamics 365.
- Connect to Data Source: Provide the necessary credentials and connection details to connect to your data source.
- Navigator Pane: Once connected, the Navigator pane will display a preview of the data and allow you to select the tables or data ranges you want to ingest.
- Select Data: Choose the relevant tables or data ranges and provide friendly names for the entities.
- Data Preview: The data preview pane will display a sample of the selected data, helping you ensure that you’re ingesting the correct information.
- Ingest Data: Once you’re satisfied with your selections, choose “Load” to ingest the data into your dataflow.
Step 3: Transforming and Shaping Data
Once you’ve ingested data, the next step is to transform and shape it according to your requirements:
- Power Query Editor: After loading data, you’ll be directed to the Power Query Editor, where you can apply a wide range of transformations.
- Renaming Entities: It’s a good practice to rename your entities to something more meaningful. Simply double-click on the entity name in the query list and provide a new name.
- Basic Transformations: The Power Query Editor offers a range of basic transformations, including:
- Selecting/Removing Columns: Use the checkboxes in the header row to select or deselect columns for inclusion in the entity.
- Renaming Columns: Right-click on a column header and choose “Rename” to provide a more descriptive name.
- Changing Data Types: Use the “Data Type” drop-down menu in the ribbon to change the data type of a column.
- Sorting: Use the “Sort” option in the ribbon or the “Sort by Column” option in the context menu to sort data.
- Advanced Transformations: For more complex data shaping, the Power Query Editor provides a range of advanced transformations:
- Filtering: Use the “Filter” option in the ribbon to apply filters based on specific criteria.
- Pivoting and Unpivoting: Pivot tables to summarize data or unpivot to transform columns into rows.
- Merging Queries: Combine data from multiple sources or entities using the “Merge Queries” option.
- Group By: Create summary data using the “Group By” option, aggregating data based on selected columns.
- Replace Values: Use this option to find and replace specific values within a column.
- Custom Columns: Add your own formulas and logic to create custom columns.
- Query Settings: The “Query Settings” option in the ribbon allows you to configure additional settings, such as data source privacy levels and data lineage options.
- Data Preview: Throughout the transformation process, use the data preview pane to ensure that your transformations are producing the desired results.
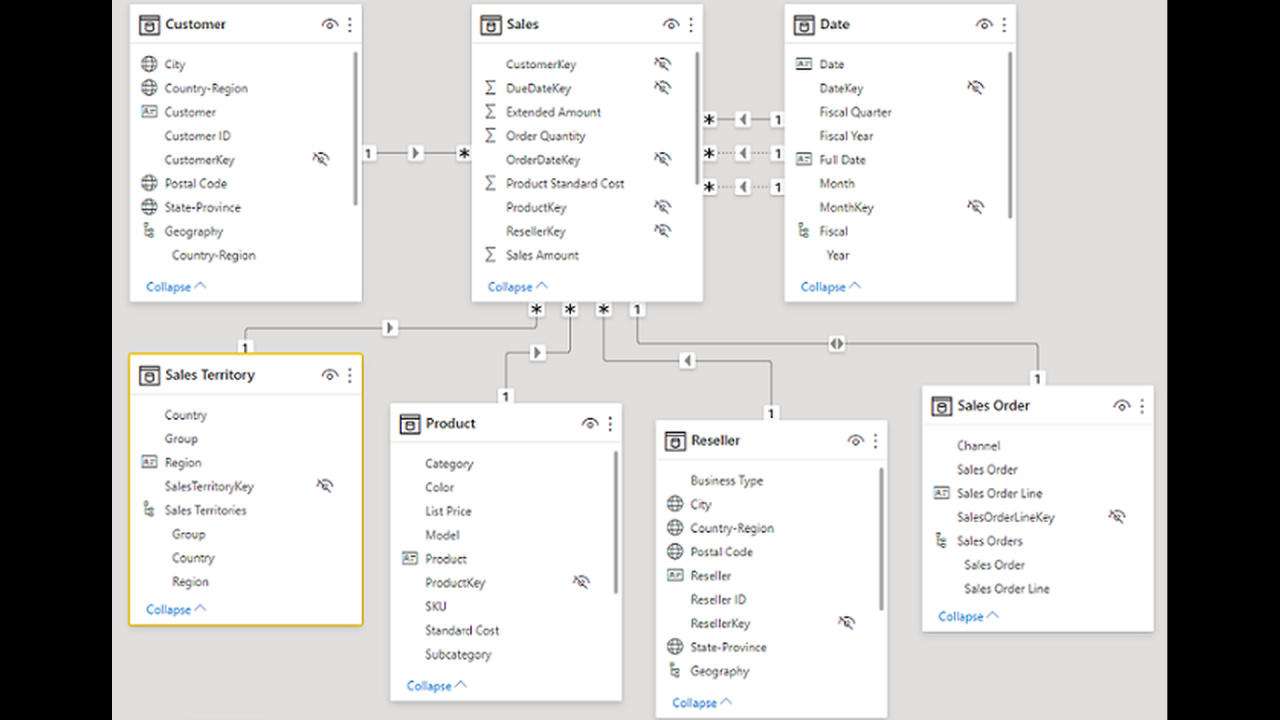
Step 4: Defining Relationships
Relationships between entities are crucial for data modeling and creating meaningful reports and dashboards:
- Entity Relationships: In the Power Query Editor, select “Manage Relationships” from the “Relationships” drop-down menu.
- Define Relationships: Identify the relationships between entities by specifying the primary key and foreign key columns. You can also set the cardinality of the relationship (one-to-one, one-to-many, etc.).
- View Relationships: The relationship diagram provides a visual representation of the defined relationships, helping you ensure that they are correctly configured.
Step 5: Storing Data and Dataflow Options
With your data transformed and relationships defined, it’s time to configure data storage and dataflow options:
- Data Storage: By default, dataflows store data in Azure Data Lake Storage Gen2. Ensure that you have the appropriate storage account configured for your workspace.
- Dataflow Options:
- Dataflow Name: Provide a descriptive name for your dataflow.
- Description: Add a description to provide additional context for other users.
- Schedule Refresh: Set a data refresh schedule to ensure that your data remains up-to-date.
- Permissions: Configure dataflow permissions to control who can view and edit the dataflow.
- Review Dataflow: Before saving, review the dataflow summary to ensure that all entities, transformations, and relationships are correctly configured.
- Save Dataflow: Once you’re satisfied, save the dataflow.
Step 6: Managing and Monitoring Dataflows
After creating your dataflow, you’ll need to manage and monitor it to ensure optimal performance and data accuracy:
- Dataflow List: In your Power BI workspace, navigate to the “Dataflows” tab to view a list of all dataflows in the workspace.
- Refresh Data:
- Manual Refresh: Select the “Refresh Now” option from the dataflow’s context menu to manually refresh the data.
- Refresh History: View the refresh history to see the status of past refreshes and identify any issues.
- Edit Dataflow:
- Edit Queries: Open the Power Query Editor to make changes to entities, relationships, or transformations.
- Add Entities: You can add new entities to an existing dataflow by selecting “Add entities” from the dataflow’s context menu.
- Dataflow Usage: View dataflow usage metrics to understand how the dataflow is being utilized across reports and dashboards.
- Data Lineage: Trace the data’s journey from source to destination using data lineage visualizations.
- Delete Dataflow: If necessary, delete the dataflow to remove it from the workspace.
Advanced Dataflow Techniques
Now that you have a grasp of the basics, let’s explore some advanced techniques to further enhance your dataflows:
Incremental Data Refresh
Instead of refreshing all data every time, you can configure dataflows to only load new or changed data. This improves refresh performance and reduces storage costs:
- Configure Incremental Refresh: In the Power Query Editor, select “Incremental refresh” from the “Data source settings” drop-down menu.
- RangeStart and RangeEnd Parameters: Use these parameters to define the date range for incremental refresh.
- Timestamp Column: Identify a column that indicates when a record was last modified to filter out records outside the specified date range.
Dataflow Templates
For dataflows that you plan to reuse across different workspaces or tenants, consider creating dataflow templates:
- Export Dataflow: In the Power BI service, select “Export” from the dataflow’s context menu to export it as a Power Query M file (.pq file).
- Import Dataflow Template: In another workspace or tenant, import the .pq file to recreate the dataflow structure, including entities, relationships, and transformations.
Dataflow Folders
As the number of dataflows in your workspace grows, consider organizing them into folders for better management:
- Create Dataflow Folder: In the Power BI service, select “New folder” from the “Dataflows” tab.
- Move Dataflows: You can move dataflows into folders by selecting “Move to folder” from the dataflow’s context menu.
Best Practices and Tips
Here are some additional tips and best practices to keep in mind when working with dataflows:
Data Quality
- Data Cleansing: Utilize data cleansing functions like “Remove Duplicates” and “Fill Down” to ensure data accuracy and consistency.
- Data Validation: Use the “Data Validation” option in the Power Query Editor to set validation rules and identify data issues.
- Data Profiling: Understand the structure and quality of your data using data profiling features.
Data Modeling
- Star Schema: Design your dataflows using a star schema, with a central fact table surrounded by dimension tables, for optimal performance in Power BI models.
- Relationships: Ensure that relationships are correctly defined, especially many-to-many relationships, which require an intermediate bridging table.
- Calculated Columns: Consider using calculated columns to derive additional insights from your data.
Performance
- Query Performance: Optimize query performance by minimizing the number of transformations and using the “Query Diagnostics” feature to identify bottlenecks.
- Data Volume: Be mindful of data volume, especially when working with large datasets. Consider sampling or aggregating data to improve performance.
- Incremental Refresh: Utilize incremental refresh to reduce the load on data sources and improve refresh times.
Conclusion and Next Steps
In this guide, we’ve taken a deep dive into the world of Power BI dataflows, covering everything from the basics of data ingestion to advanced data transformation techniques. Dataflows offer a powerful tool for data preparation, and when used effectively, they can significantly enhance the quality and efficiency of your Power BI solutions.As you continue on your dataflow journey, here are some questions to consider:
- How can you ensure data quality and data governance in your dataflows?
- What processes can you implement to validate and cleanse data before loading it into Power BI models?
- How can you optimize dataflows for performance?
- Are there techniques you can employ to reduce data volume or improve query performance?
- How can you leverage dataflows to support self-service BI in your organization?
- Can dataflows be used to provide a centralized and governed data platform for business users to create their own reports and dashboards?
Feel free to share your thoughts and experiences in the comments, and continue exploring the power of data preparation with Power BI dataflows!