Introduction
In the world of finance, data is power. Making sense of vast datasets can mean the difference between stagnant growth and strategic, profitable decisions. This is where Power BI steps in, offering a transformative approach to data analysis and visualization.Power BI is a powerful tool that has gained significant traction in the finance sector due to its ability to provide profound insights, streamline financial processes, and drive data-backed decisions. In this article, we’ll delve into the specific ways in which Power BI is revolutionizing financial analysis, back it up with real-world examples, and explore the tangible benefits it brings to the table.By the end, you should have a comprehensive understanding of how Power BI can be leveraged in the finance industry to unlock the full potential of your data.
Understanding Power BI’s Relevance in Finance
Power BI is a business analytics solution offered by Microsoft. It transforms data from various sources into interactive visuals and actionable insights. The platform has become indispensable for financial analysts, investors, and decision-makers in the finance sector due to its robust capabilities.Here’s why Power BI is particularly relevant in the context of financial analysis:
1. Comprehensive Data Connectivity
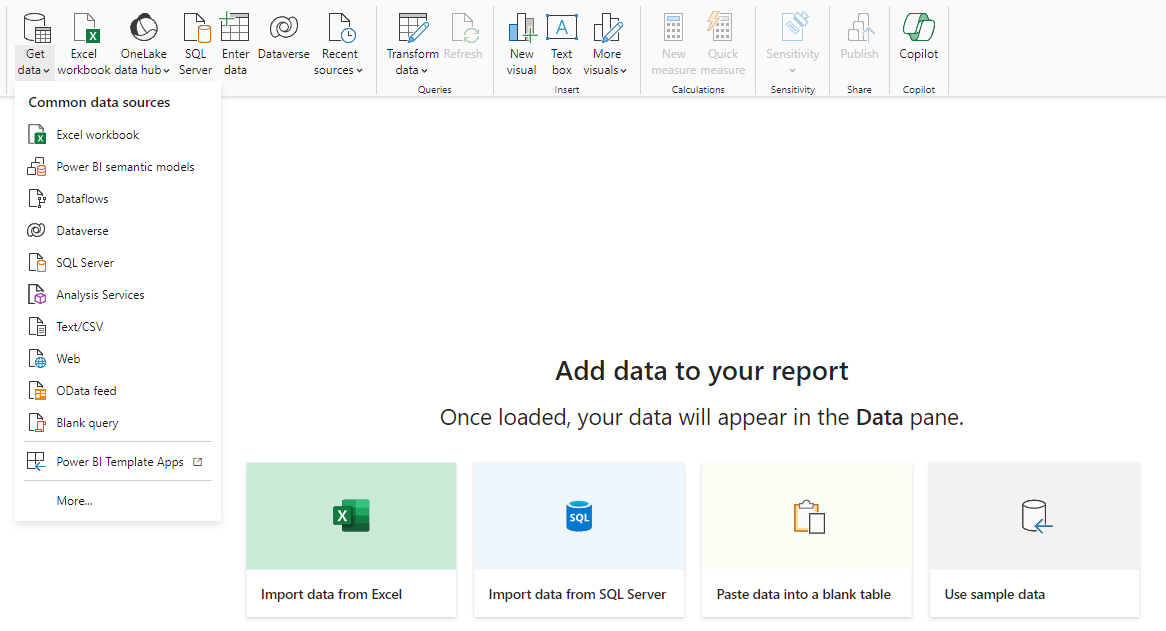
Power BI connects seamlessly with a multitude of data sources, including Excel spreadsheets, on-premises databases, and cloud-based services like Microsoft Dynamics 365, Salesforce, and more. This is crucial in finance, where data resides in various formats and locations. For example, a financial analyst can connect Power BI to their organization’s ERP system, pulling data from sales, inventory, and accounting software to create a comprehensive financial dashboard.
2. Robust Data Modeling
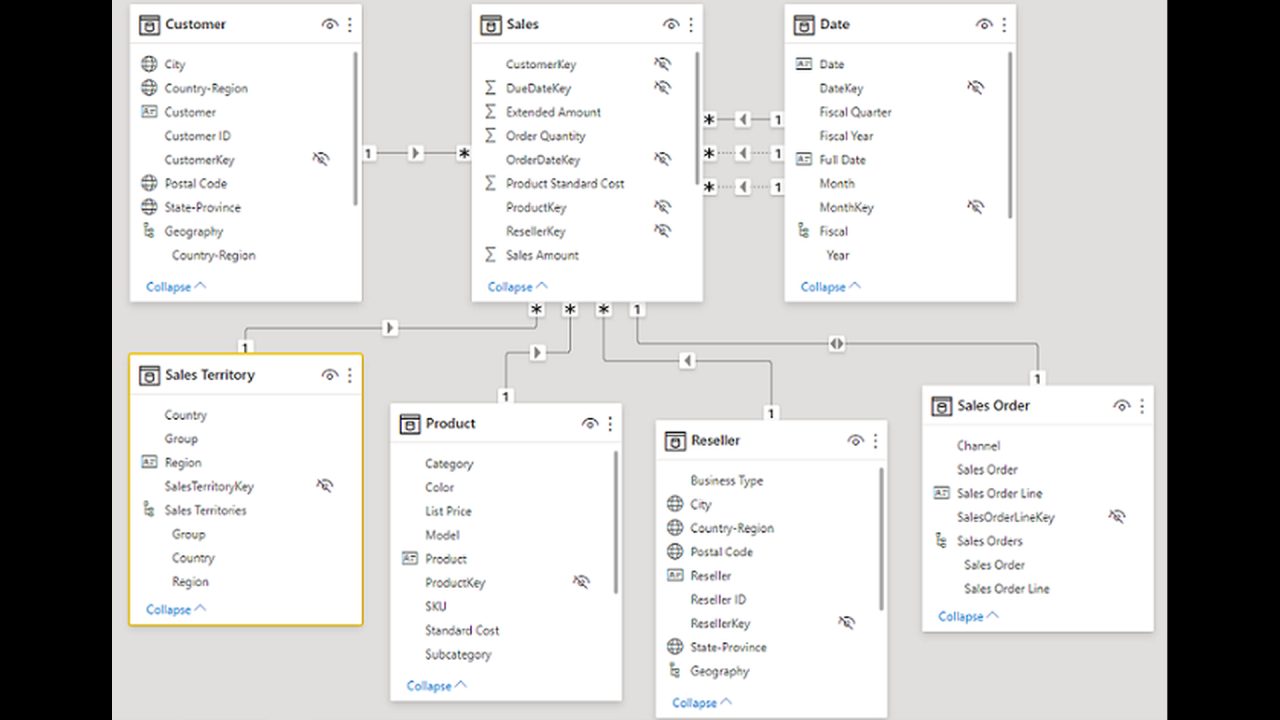
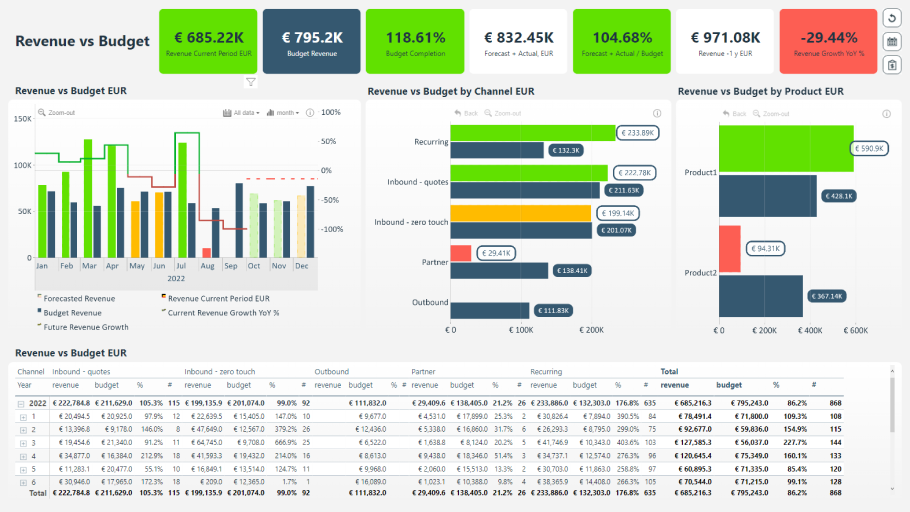
Power BI allows users to create robust data models, leveraging relationships between tables and utilizing complex logic through its formula language, DAX (Data Analysis Expressions). This enables financial analysts to calculate key performance indicators (KPIs), create hierarchies, and build flexible models that adapt to changing business needs.For instance, a revenue analysis model in Power BI can calculate metrics like year-over-year growth, profit margins, and forecast trends, providing a dynamic view of financial performance.
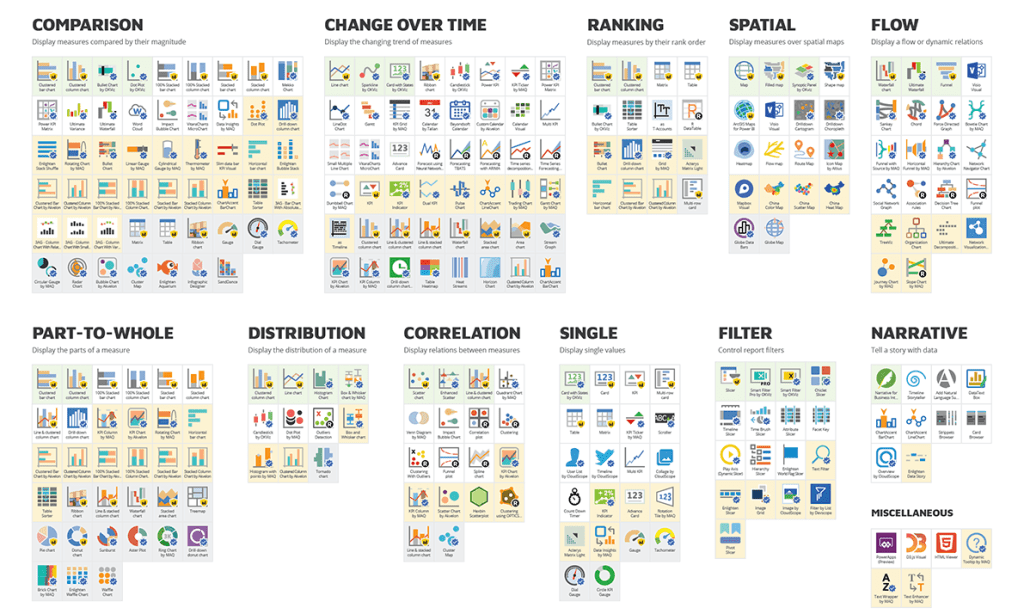
3. Visual Data Exploration
The platform offers a wide range of visual tools, from basic charts and graphs to more interactive visuals like treemaps, waterfall charts, and custom maps. This visual exploration makes it easier for financial professionals to identify patterns, trends, and outliers in large datasets.Imagine a regional sales manager using Power BI to visualize sales performance across different territories. With interactive maps, they can quickly identify top-performing regions, drill down to the city level, and even compare sales figures with demographic data to uncover new market opportunities.
4. Self-Service BI
Power BI empowers finance professionals to conduct ad-hoc analysis and create reports independently, without relying heavily on IT or data engineering teams. This self-service BI approach accelerates the time-to-insight, enabling faster decision-making.For example, a financial analyst can quickly build a report on expense trends, identify areas of concern, and present cost-saving initiatives to management, all within a matter of hours, not days or weeks.
5. AI-Assisted Insights
Power BI’s AI capabilities, such as Quick Insights and automated machine learning models, can uncover hidden patterns and correlations in financial data. These insights can lead to more accurate forecasting, predictive analytics, and scenario planning.A treasury manager, for instance, could use Power BI’s AI capabilities to predict cash flow needs, optimize investment strategies, and manage liquidity risks more effectively.
Specific Use Cases in Financial Analysis
Let’s explore some specific scenarios where Power BI adds significant value to financial analysis:
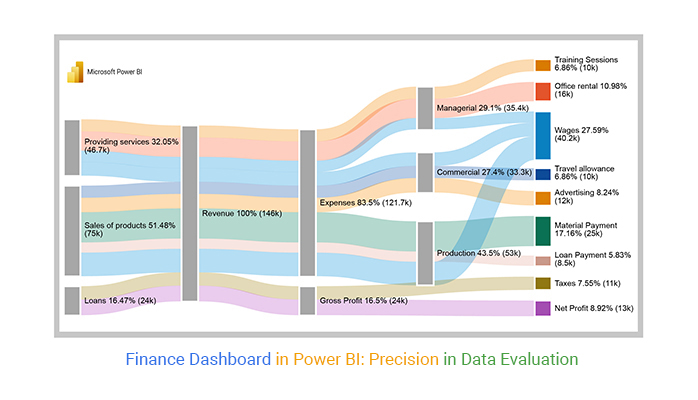
1. Financial Reporting & Dashboarding
- Dynamic Financial Reports: Power BI allows finance teams to create dynamic financial reports that update in real time. Instead of static Excel sheets or PowerPoint presentations, stakeholders can interact with the data, drill down into specifics, and even explore “what-if” scenarios.
- Consolidated View: By connecting multiple data sources, Power BI provides a consolidated view of financial data. This could include actuals, budgets, forecasts, and variance analysis, all in one place.
- Automated Distribution: Reports and dashboards can be automatically distributed to relevant stakeholders, ensuring everyone is working with the latest information.
Example: A publicly traded company uses Power BI to create a dynamic earnings report. Beyond the standard financial statements, they include interactive visuals that showcase revenue growth, market share gains, and operational efficiencies. This allows investors and analysts to explore the data, gaining deeper insights into the company’s performance.
2. Budgeting & Forecasting
- Driver-Based Planning: Power BI enables budgeting and forecasting processes by allowing users to build models that incorporate key business drivers. These models can be easily adjusted to reflect changing market conditions or strategic priorities.
- Scenario Analysis: With Power BI, finance teams can quickly run multiple scenarios to assess the financial impact of different decisions. This could include M&A activity, new product launches, or changes in pricing strategies.
- Rolling Forecasts: The platform facilitates the creation of rolling forecasts, enabling finance teams to continuously update predictions based on the latest data and market trends.
Example: A retail chain uses Power BI to create a budgeting and forecasting model that incorporates sales data, customer demographics, and market trends. By adjusting variables like marketing spend or store openings, they can instantly see the impact on revenue and profitability, allowing for more agile decision-making.
3. Data-Driven Decision-Making
- Actionable Insights: Power BI helps financial analysts uncover actionable insights from data. This could include identifying cost-saving opportunities, optimizing pricing strategies, or discovering new revenue streams.
- Predictive Analytics: The platform’s AI capabilities enable predictive analytics, helping finance professionals forecast trends, identify potential risks, and make more informed decisions.
- Real-Time Monitoring: By connecting to real-time data sources, Power BI allows users to monitor key financial metrics as they happen, enabling faster reaction times and more proactive decision-making.
Example: A fintech startup uses Power BI to analyze customer transaction data, identifying patterns that indicate potential churn. By combining this with customer feedback and market research, they develop more targeted retention strategies, ultimately reducing churn rates and improving customer lifetime value.
4. Regulatory Compliance & Audit
- Data Governance: Power BI helps finance organizations maintain data governance and compliance standards. Role-based security, data encryption, and audit logs ensure that sensitive financial data is secure and accessible only to authorized users.
- Audit Trails: The platform’s audit capabilities provide a detailed history of report changes, data updates, and user access, which is crucial for regulatory compliance and internal controls.
- Custom Compliance Reports: Power BI allows users to create custom reports and dashboards that align with specific regulatory requirements, such as GAAP or IFRS.
Example: A global bank uses Power BI to create a compliance dashboard that monitors transactions for potential money laundering activities. By applying advanced analytics and machine learning algorithms, they can identify suspicious patterns and anomalies, ensuring compliance with anti-money laundering regulations.
Benefits of Power BI in the Finance Sector
Adopting Power BI in the finance sector brings about several tangible benefits that impact not just the efficiency of financial processes but also the overall strategic direction of organizations:
1. Improved Data Accuracy & Consistency
Power BI reduces the risk of errors by automating data collection and calculation processes. The platform’s data modeling capabilities ensure that calculations are consistent and applied across the entire dataset, minimizing the chance of human error.
2. Enhanced Data Security
With Power BI, sensitive financial data is protected through robust security features, including encryption, data protection policies, and role-based access controls. This ensures that only authorized users can access and modify critical information.
3. Accelerated Time-to-Insight
The platform’s self-service capabilities and intuitive interface empower finance professionals to conduct analyses and create reports faster. This accelerated time-to-insight means decisions can be made more swiftly and confidently.
4. Cost Savings
By leveraging Power BI’s data visualization and analytics capabilities, organizations can identify cost-saving opportunities, optimize spending, and streamline financial processes, leading to significant cost savings.
5. Better Strategic Alignment
Power BI enables finance teams to provide actionable insights that inform strategic decisions. By connecting financial data with operational metrics, organizations can align their financial strategies with overall business goals, ensuring resources are allocated efficiently.
Conclusion
Power BI is transforming the way financial analysis is conducted, empowering finance professionals to unlock the full potential of their data. Its ability to connect, model, and visualize data, along with its AI capabilities, makes it an indispensable tool for financial analysts, investors, and decision-makers.As showcased in the use cases, Power BI enhances financial reporting, budgeting, forecasting, and compliance, providing actionable insights that drive data-backed decisions. The benefits are clear: improved data accuracy, enhanced security, accelerated insights, cost savings, and better strategic alignment.Here’s a final thought to consider: How can organizations in the finance sector leverage Power BI to not just streamline existing processes but also unlock innovative ways of using data to gain a competitive edge?The possibilities are endless, and the impact is profound. It’s time for finance professionals to embrace the power of Power BI and drive their organizations forward in the data-driven economy.Feel free to share your thoughts and experiences using Power BI in the finance sector! What benefits have you witnessed, and what innovative use cases have you explored?