Power BI is a powerful tool in the hands of businesses and data analysts, offering robust data visualization and insight generation capabilities. However, its true potential is unlocked when Power BI is integrated with other tools and services, creating a seamless flow of data and insights across an organization.This article will take you on a journey, exploring the various integration options available with Power BI, and how these can enhance your business intelligence and data analysis capabilities. We’ll cover the benefits, provide step-by-step guides to key integrations, and offer best practices to ensure your Power BI implementations are effective and user-friendly.By the end, you should have a comprehensive understanding of how to leverage Power BI’s flexibility to create a cohesive and insightful BI ecosystem.
Power BI Integrations – Why Bother?
At its core, Power BI is a fantastic data visualization platform, offering intuitive drag-and-drop report creation, a wide range of chart and graph options, and powerful data modeling capabilities. However, to truly make an impact in an organization, it is beneficial to integrate Power BI with other tools and services for the following key reasons:
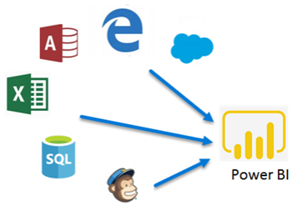
- Data Sources: Power BI can connect to a vast array of data sources, but there are times when specific data resides in niche applications or legacy systems. Integrations can help bring this data into Power BI, creating a single source of truth.
- Collaboration: Integrations with collaboration tools like Microsoft Teams or Slack can ensure that insights are shared and discussed easily across teams, improving decision-making.
- Automation: By integrating with tools that automate processes, you can ensure data is always up-to-date, triggering refreshes and notifications when needed.
- Custom Visuals: While Power BI has an extensive visual library, sometimes unique data requires custom visuals. Integrations with tools like D3.js or R can help create these.
- Actionable Insights: Integrations allow you to go beyond just visualization, enabling you to take action on insights. For example, integrating with CRM systems can allow you to immediately act on sales insights.
Key Integrations to Enhance Your BI Ecosystem
There are numerous ways to integrate Power BI with other tools and services, and the right approach depends on your specific needs. Here are some of the most common and beneficial integrations, along with step-by-step guides to get you started.
1. Connecting to Data Sources
Direct Connections
Power BI shines when it comes to connecting to data sources, offering out-of-the-box connectors to popular databases and applications. Here’s a step-by-step guide to setting up a direct connection to a data source:
- Launch Power BI Desktop: Start by opening the Power BI Desktop application.
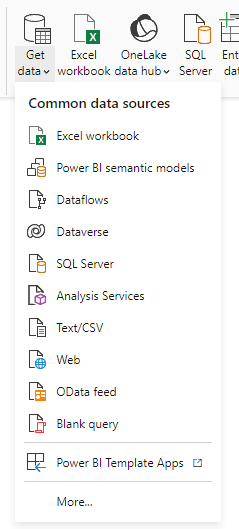
- Select Data Source: On the Home tab, click “Get Data” and choose your data source from the extensive list of options. Common choices include Excel, SQL Server, and SharePoint.
- Connect to Source: A new window will appear. Here, you need to provide the details of your data source, such as the server address, database name, and credentials (if required).
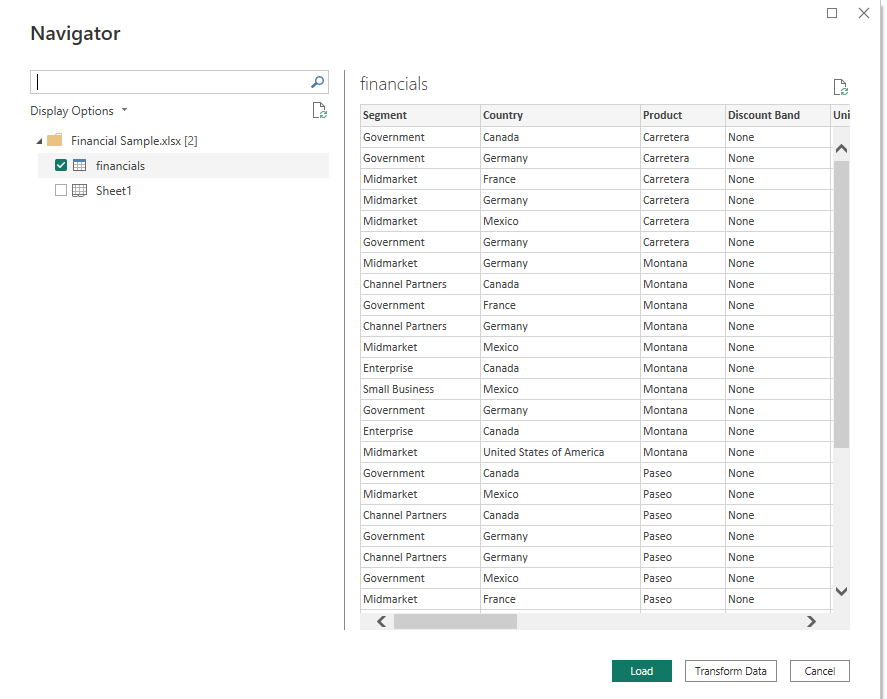
- Navigator: Once connected, the Navigator window will show a preview of your data and a list of tables available. You can select specific tables or entire datasets to import.
- Transform Data (Optional): Before loading, you can use the “Transform Data” option to clean and prepare your data, renaming columns, creating calculations, and setting data types.
- Load Data: Finally, click “Load” to bring the data into Power BI, creating a dataset that you can now use to build visualizations and reports.
API Connections
For more niche or custom data sources, you may need to connect via an API. Here’s a guide to setting this up:
- Identify API Endpoints: First, you need to determine the API endpoints that provide the data you require. This may involve consulting the API documentation of the service you wish to connect to.
- Use Web Connector: In Power BI Desktop, under “Get Data,” select “Web” to use the Web connector.
- Provide API URL: A new window will appear where you can enter the URL for the API endpoint you wish to connect to. You may also need to provide headers or parameters, depending on the API.
- Authentication: If the API requires authentication, you can set this up by clicking “Edit” and providing the necessary credentials or tokens.
- Shape Data: Once connected, you will see a preview of the data. You can now shape and transform this data to your requirements, ensuring it is ready for use in your reports.
- Load Data: As with direct connections, click “Load” to bring the data into Power BI and start building your visualizations.
2. Automating Data Refreshes
Having real-time or near real-time data is crucial for making timely decisions. Power BI offers several ways to automate data refreshes to ensure your reports are always up-to-date.
1. Scheduled Refreshes
Power BI allows you to set a schedule for data refreshes, ensuring your data is regularly updated without any manual intervention.
- Open Power BI Service: Go to the Power BI service (web version) and select the workspace where your dataset is located.
- Dataset Settings: Click on the ellipses (three dots) next to your dataset and select “Settings.”
- Data Source Credentials: Ensure that you have the correct data source credentials set up. If not, you can edit these under the “Data source credentials” section.
- Schedule Refresh: In the “Scheduled refresh” section, toggle the setting to “On.” Here, you can set the frequency of refreshes and the time of day they should occur.
- Notify on Failure: It is a good practice to turn on “Send refresh failure notifications to me,” so you are alerted if a refresh doesn’t complete successfully.
2. Using Power Automate
For more complex refresh requirements, you can use Power Automate (formerly Microsoft Flow) to trigger data refreshes based on specific events or conditions.
- Create a New Flow: In Power Automate, start by selecting “Create” and then choosing “Desktop Flow” to create a new flow.
- Select Trigger: The first step is to choose a trigger for your flow. This could be a recurrence (similar to a scheduled refresh), or a specific event, like a file being added to a folder.
- Add Actions: Once triggered, you can add actions to your flow. Search for “Power BI” and select the “Refresh a dataset” action.
- Configure Action: You will need to provide details such as the workspace, dataset, and authentication method.
- Additional Actions: You can further customize your flow by adding actions like sending emails or posting to Microsoft Teams channels when a refresh is complete.
- Save and Test: Once configured, save your flow and test it to ensure it works as expected.
3. Custom Visuals
While Power BI has an extensive library of visuals, sometimes you need something unique to truly bring your data to life. Integrating custom visuals can be a powerful way to do this.
1. Using the Custom Visuals Marketplace
Power BI users have a wealth of custom visuals available via the official Marketplace.
- Open Marketplace: In Power BI Desktop, go to the “Visualizations” pane and click on the ellipses (three dots) to open the “Options” menu. Select “Import from Marketplace.”
- Browse or Search: The Marketplace window will appear, allowing you to browse or search for the custom visual you require. You can filter by categories like charts, maps, or gauges.
- Import Visual: Once you’ve found a suitable visual, click “Add” to import it into your report. You will then be able to use this visual like any other, dragging and dropping fields to configure it.
2. Building Your Own
For truly unique requirements, you can build your own custom visuals using tools like D3.js or R.
- Choose Your Tool: Start by deciding if you want to use D3.js (a JavaScript library) or R (a programming language for statistical computing). Both have extensive communities and resources available.
- Develop Your Visual: Using the chosen tool, develop your custom visual to meet your specific requirements. This may involve creating a completely new visual or customizing an existing one.
- Package and Import: Once your visual is ready, you need to package it as a .pbiviz file. You can then import this file into Power BI Desktop, following a similar process to importing from the Marketplace.
- Configure and Use: Your custom visual will now appear in your list of available visuals, ready for you to configure and use in your reports.
4. Collaboration and Sharing
Effective collaboration ensures that insights are shared and discussed, leading to better decision-making. Integrating Power BI with collaboration tools enhances this process.
1. Microsoft Teams Integration
Microsoft Teams is a powerful collaboration platform, and its integration with Power BI allows for seamless sharing and discussion of insights.
- Add Power BI App: In Microsoft Teams, go to the specific channel where you want to share insights. Click “Apps” in the left sidebar and search for “Power BI.” Select the Power BI app and click “Add.”
- Pin a Report: Once added, click on the Power BI app in the channel and sign in with your Power BI account. You can now pin a specific report to this channel, making it always accessible to team members.
- Discuss and Analyze: Team members can now view and discuss the report directly within Teams, making it a central hub for collaboration and analysis.
2. Slack Integration
Slack is another popular collaboration tool, and it too can be integrated with Power BI for efficient sharing.
- Install Power BI App: In Slack, go to the App Directory and search for “Power BI.” Install the Power BI app to your Slack workspace.
- Sign In and Authorize: Once installed, click “Add to Slack” and follow the prompts to sign in to your Power BI account and authorize the integration.
- Share Reports: You can now share Power BI reports directly in Slack channels or via direct messages. Simply click the “+” sign to add a message, select the Power BI app, and choose the report you wish to share.
- Discuss and Analyze: As with Microsoft Teams, Slack users can now discuss and analyze the insights directly within the platform they use for collaboration.
Best Practices for Effective Power BI Integrations
When implementing Power BI integrations, there are several best practices to keep in mind to ensure your implementations are effective and user-friendly.
- Understand User Needs: Before implementing any integration, ensure you thoroughly understand the needs of your users. What data do they require? How do they want to collaborate and share insights?
- Keep it Simple: Start with simple implementations and build from there. Unnecessary complexity can hinder user adoption.
- Consistent Data Modeling: Ensure consistent data modeling practices across all your integrations to make it easier for users to navigate and understand reports.
- Test Extensively: Always test your integrations thoroughly before rolling them out to users. This includes testing for data accuracy, performance, and user experience.
- Provide Documentation: Create user-friendly documentation to guide users through any new processes or features resulting from your integrations.
- Regular Review: Schedule regular reviews of your Power BI integrations to ensure they remain effective and up-to-date. This includes reviewing the security and access controls for your data.
- Mobile Optimization: With the rise of remote work, ensure your Power BI reports and integrations are optimized for mobile devices, allowing users to access insights on the go.
Conclusion
Power BI integrations offer a powerful way to enhance your business intelligence capabilities, creating a seamless flow of data and insights across your organization. By connecting to diverse data sources, automating processes, and integrating with collaboration tools, you can ensure that insights are actionable, timely, and accessible to those who need them.The step-by-step guides and best practices provided in this article should give you a strong foundation for implementing effective Power BI integrations. However, every organization is unique, and there are always new ways to leverage Power BI’s flexibility.With that in mind, what are some specific challenges or opportunities you are considering when it comes to Power BI integrations? How might you further enhance your BI ecosystem to drive better decision-making and business outcomes?These are questions worth exploring as you continue to unlock the power of Power BI.