Introduction
In today’s data-driven world, organizations are constantly seeking ways to extract valuable insights from their data to stay ahead of the competition. Microsoft Power BI is a leading business intelligence platform that empowers users to transform data into actionable knowledge. However, the true potential of Power BI lies in its seamless integrations with other widely used tools such as Excel and SQL Server.In this article, we will delve into the significance of Power BI integrations and provide a step-by-step guide on how to integrate Power BI with Excel and SQL Server, unlocking a whole new level of data analysis capabilities. By the end, you should have a comprehensive understanding of why and how to leverage these integrations to enhance your data-driven decision-making processes.
Why Are Power BI Integrations Important?
Power BI integrations play a crucial role in streamlining data analysis and enabling a more holistic understanding of data. Here are some key reasons why integrations are essential:
- Data Unification: Organizations often have data scattered across different systems and tools, such as Excel spreadsheets, SQL databases, and cloud-based applications. Power BI integrations allow you to bring all this data together in one centralized platform. This unified view enables a comprehensive analysis, helping you identify patterns and trends that may otherwise be missed.
- Seamless Data Refresh: Integrations ensure that your data remains up-to-date across different systems. For example, when you integrate Power BI with a SQL database, you can set up automatic data refreshes. This feature ensures that your reports and dashboards always reflect the latest information, allowing you to make timely and informed decisions.
- Enhanced Data Visualization: Power BI is renowned for its robust data visualization capabilities. By integrating with Excel or SQL Server, you can leverage these capabilities to create stunning visual reports and dashboards. This not only makes complex data more digestible but also facilitates a deeper understanding of the information, leading to better decision-making.
- Advanced Analytical Capabilities: Power BI integrations unlock a world of advanced analytical possibilities. For instance, you can combine Excel’s powerful formulas and functions with Power BI’s data modeling and visualization features. This enables you to perform intricate calculations, build sophisticated models, and conduct what-if analyses, all within a single platform.
- Improved Data Security: Integrations also enhance data security and compliance. Power BI provides robust data protection features, ensuring that sensitive information remains secure. By integrating with other tools, you can control data access, set permissions, and maintain data integrity, minimizing the risks associated with data handling.
- Scalability and Flexibility: As your organization grows, so does your data volume and complexity. Power BI integrations offer the scalability needed to handle large datasets efficiently. Additionally, the flexibility to connect with various data sources ensures that Power BI can adapt to your changing needs, making it a long-lasting investment.
Integrating Power BI with Excel
Excel is one of the most widely used spreadsheet software, and chances are, your organization already relies on it for basic data analysis and reporting. Here’s how you can enhance your Excel workflows by integrating it with Power BI:
- Import Excel Data into Power BI:
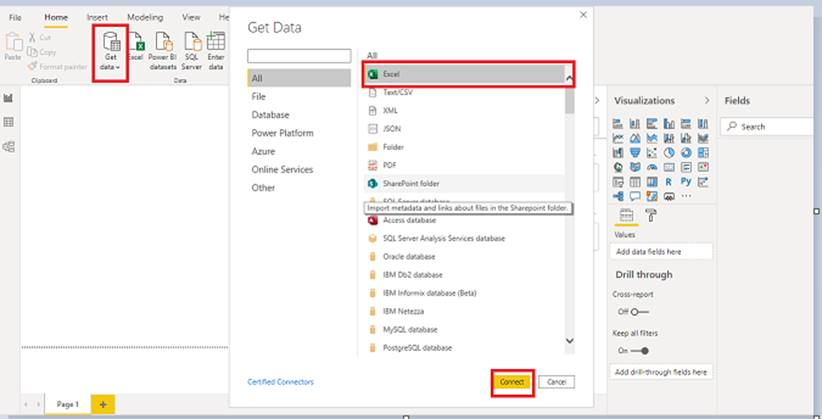
- Open Power BI Desktop and select “Get Data” from the Home ribbon.
- Choose “Excel” from the list of data sources and browse to select your Excel file.
- Navigate through the tables, ranges, or worksheets within the file and select the data you want to import.
- You can either load the data directly into Power BI or transform and clean it using the Query Editor before loading.
- Analyze in Excel:
- This feature allows you to use Excel’s familiar interface while leveraging Power BI’s capabilities.
- In Power BI Desktop, right-click on your dataset and select “Analyze in Excel”.
- Choose whether to use an existing Excel workbook or create a new one.
- Excel will open with a live connection to your Power BI dataset, allowing you to use PivotTables, charts, and formulas dynamically.
- Pin Excel Visuals to Power BI:
- You can also pin visuals from Excel to your Power BI reports.
- In Excel, select the range of cells containing the visual you want to pin.
- On the Home ribbon, click “Pin”, and then select “Power BI Dashboard” to choose the dashboard where you want to pin the visual.
- Sync Changes between Excel and Power BI:
- Changes made in Excel can be synced back to Power BI.
- In Excel, go to the “Data” ribbon and click “Sync”.
- This updates the corresponding dataset in Power BI with any changes made in Excel.
Example: Excel Integration for Financial Reporting
Imagine you work in the finance department, and you have historical financial data in Excel spreadsheets. By integrating Excel with Power BI, you can create dynamic financial reports that update in real time. Use Excel’s formulas to calculate key financial metrics, and then visualize these metrics in Power BI with interactive charts and graphs. This integration ensures that your financial reports are always based on the latest data, enabling accurate decision-making.
Integrating Power BI with SQL Server
SQL Server is a powerful relational database management system used by many organizations to store and manage data. Here’s how you can leverage Power BI’s integration with SQL Server:
- Connect to SQL Database:
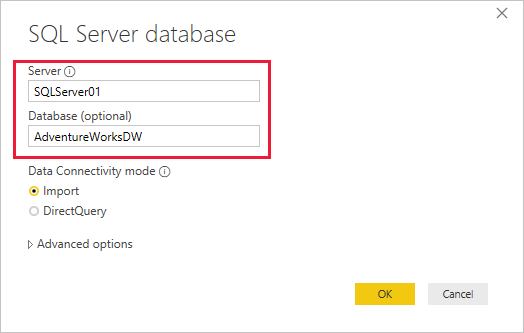
- In Power BI Desktop, select “Get Data” and choose “SQL Server” as the data source.
- Provide the server name and database details to establish a connection.
- Choose Data Retrieval Method:
- Power BI offers two methods for retrieving data from SQL Server: Import and DirectQuery.
- Import brings a snapshot of the data into Power BI, allowing for faster report performance but requiring manual data refreshes.
- DirectQuery keeps a live connection, ensuring real-time data but may impact report performance with large datasets.
- Select Tables and Views:
- Once connected, you can select the tables, views, or specific columns you want to import or query.
- You can also use the Query Editor in Power BI to transform and clean the data before loading it into your report.
- Set Scheduled Refresh:
- For import mode, you can set up scheduled data refreshes to keep your reports up-to-date.
- Specify the refresh frequency, and Power BI will automatically connect to your SQL Server and retrieve the latest data.
Example: SQL Server Integration for Sales Analytics
Let’s say you’re in sales and you have customer and sales data stored in a SQL Server database. By integrating Power BI with SQL Server, you can create dynamic sales dashboards that update in real time. Use Power BI’s data modeling and visualization features to analyze sales trends, identify top-performing products, and track sales targets. With DirectQuery, your dashboards will always reflect the latest sales data, ensuring your team has the most accurate information.
Best Practices for Power BI Integrations
- Data Security: Ensure that data transferred between systems is secure and compliant with relevant regulations. Use encryption, access controls, and other security measures to protect sensitive information.
- Data Quality: Integrations can only be as good as the data they connect. Ensure data cleanliness and consistency across systems to avoid discrepancies and inaccurate insights.
- Performance Optimization: Large datasets and complex queries can impact performance. Use Power BI’s data optimization techniques, such as data compression, relationship management, and DAX formulas, to improve report performance.
- Governance and Documentation: Establish clear governance policies and documentation practices for your Power BI integrations. This ensures that integrations are well-managed, auditable, and maintainable over time.
- User Training and Support: Provide adequate training and support to users adopting Power BI integrations. This helps them understand the benefits and encourages proper usage, leading to higher adoption rates.
Conclusion
Power BI integrations with Excel and SQL Server unlock a new dimension of data analysis, empowering organizations to derive deeper insights and make more informed decisions. By bringing together the strengths of these tools, businesses can streamline their data workflows, enhance reporting capabilities, and leverage real-time data to stay ahead of the competition.As we’ve explored, the seamless integration of Power BI with Excel and SQL Server not only improves data unification and visualization but also enables advanced analytical capabilities. With step-by-step guides and examples, we’ve shown how these integrations can be leveraged in finance and sales contexts to drive accurate and timely decision-making.Now, it’s your turn to share your experiences! How have Power BI integrations transformed your data analysis processes? What unique ways have you found to combine Power BI with Excel or SQL Server? Feel free to share your thoughts and insights in the comments below!Let’s continue the conversation and explore the endless possibilities of Power BI integrations together!