Real-time analytics refers to the process of collecting, analyzing, and interpreting data as it occurs, providing immediate insights that can drive timely actions. In the context of Power BI, this involves utilizing the platform’s streaming data and live dashboard features to visualize and interact with data as it is generated.Power BI’s real-time analytics capabilities are particularly useful for scenarios where data is constantly changing and immediate action is required. For example, monitoring stock prices, tracking website traffic, managing inventory levels, or analyzing social media sentiment. With real-time data visualization, organizations can spot anomalies, identify trends, and make data-driven decisions with minimal delay.
Benefits of Real-Time Analytics
- Timely Decision Making: Real-time analytics empowers businesses to make decisions based on the most current data available. This is especially valuable in dynamic markets or time-sensitive situations, where delaying a decision could result in missed opportunities or costly mistakes.
- Rapid Problem Solving: With streaming data, organizations can quickly identify and troubleshoot issues as they arise. For instance, a manufacturing company could use real-time data to detect and address equipment malfunctions immediately, minimizing production downtime.
- Enhanced Customer Experience: By analyzing customer behavior as it happens, businesses can deliver more personalized and responsive experiences. Real-time analytics can be used to monitor customer feedback, identify pain points, and make immediate improvements to products or services.
- Competitive Advantage: The ability to react swiftly to market changes and trends can set businesses apart from their competitors. Real-time analytics enables organizations to be agile, adapt their strategies, and stay ahead of the curve.
Streaming Data in Power BI
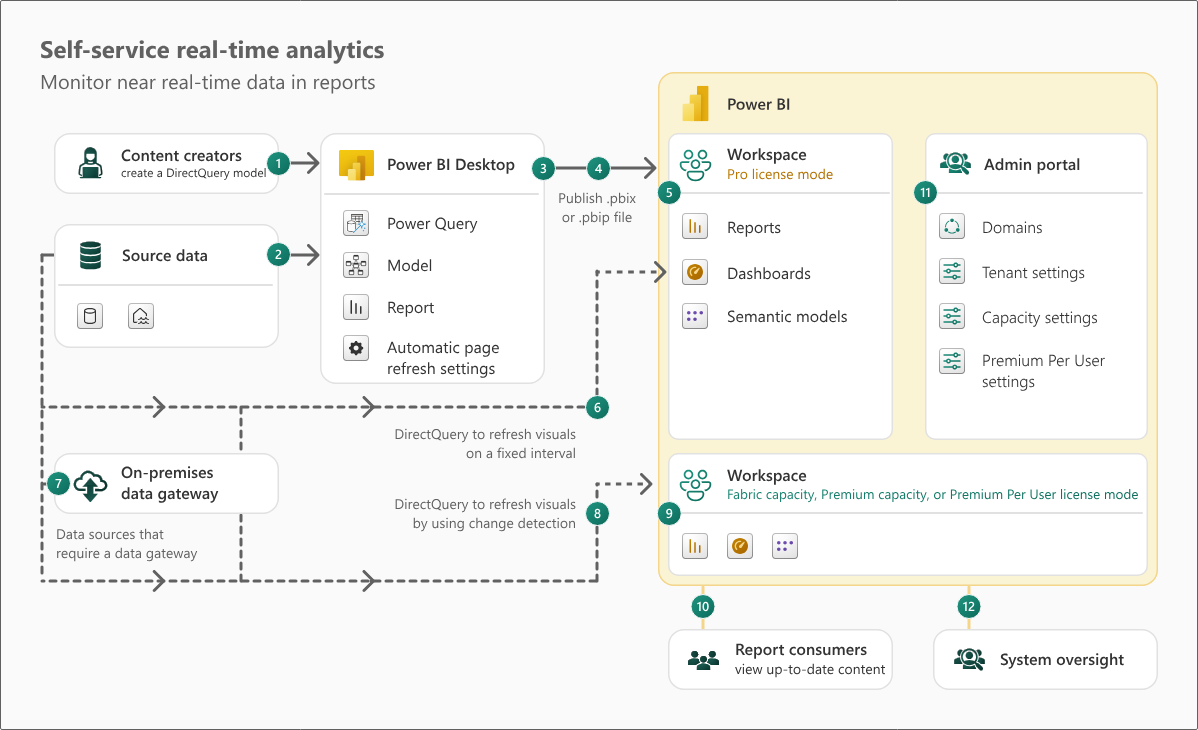
Streaming data in Power BI involves the continuous ingestion and processing of data as it’s generated, enabling near-real-time analysis and visualization. This is in contrast to traditional data loading, where data is imported or refreshed at scheduled intervals. With streaming data, Power BI can provide up-to-the-second insights, making it ideal for time-critical scenarios.
Enabling Streaming Data in Power BI
To enable streaming data in Power BI, you’ll need to create a streaming dataset. Here’s a step-by-step guide:
- Prepare Your Data: Ensure your data is in a format suitable for streaming. It should be time-series data, with each entry containing a timestamp and the relevant metrics or measurements.
- Create a Streaming Dataset: Open Power BI Desktop and select “Get Data” from the Home tab. Choose “Other” from the data source options, then select “API” and click “Connect”. Provide a name for your data source and the URL endpoint for your streaming data (this could be an IoT device, web application, or any other data source that supports streaming).
3, Set Data Source Format: Specify the data source format by selecting “Advanced options” and choosing “Streaming data source” from the drop-down menu. You can also define the maximum wait time for data retrieval and the maximum row count per data retrieval.
- Select Tables: Choose the tables you want to include in your dataset. You can preview the data to ensure it’s as expected.
- Load the Data: Click “Transform Data” to load the streaming data into Power BI. You can now use this dataset to create real-time visualizations and reports.
Best Practices for Streaming Data
- Ensure Data Quality: Given the continuous nature of streaming data, it’s crucial to implement data quality checks. Monitor your data for anomalies, missing values, or inconsistencies that could impact your analysis.
- Manage Data Volume: Streaming data can quickly accumulate, leading to large dataset sizes. Consider using data aggregation or archiving strategies to manage the volume and improve query performance.
- Secure Your Data: Protect sensitive streaming data with appropriate security measures, such as encryption and access controls. Power BI offers role-based security and data protection features to help safeguard your data.
- Test and Monitor: Regularly test and monitor your streaming data setup to ensure it functions as expected. This includes checking data connectivity, verifying data freshness, and assessing the performance of your visualizations.
Live Dashboards in Power BI
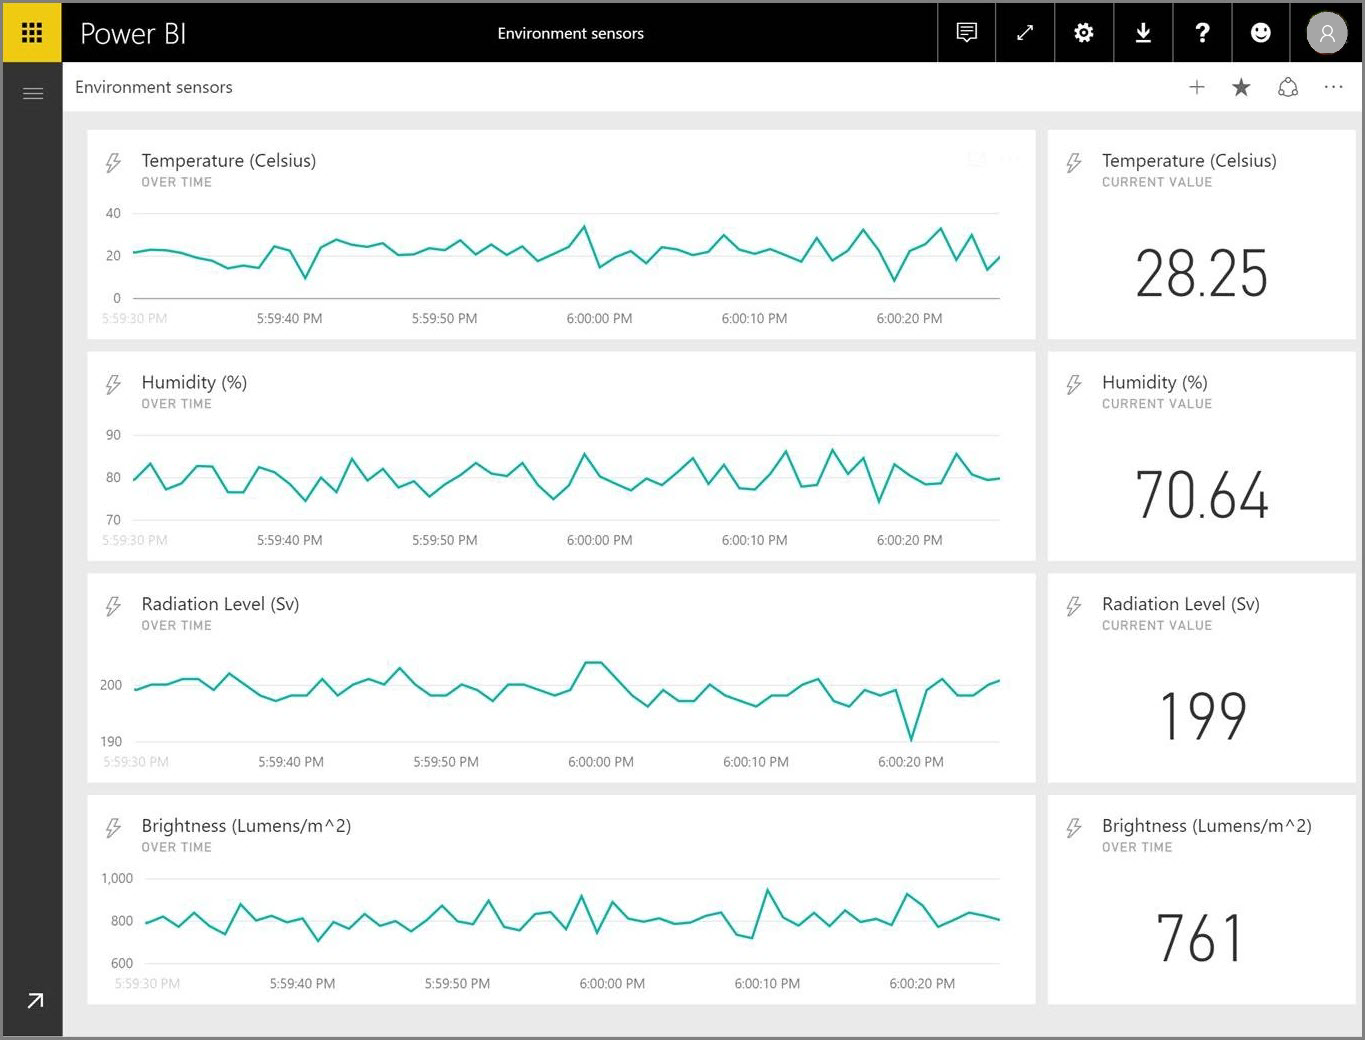
Live dashboards in Power BI are dynamic displays that update automatically as underlying data changes, providing a real-time view of key metrics and KPIs. These dashboards can be customized to show specific data sources, visualizations, and updates at specified intervals, ensuring that users always have access to the most current information.
Creating a Live Dashboard in Power BI
To create a live dashboard in Power BI:
- Prepare Your Data: Ensure your streaming dataset is ready and connected to Power BI. You can also use traditional datasets that are set to refresh at regular intervals.
- Open Power BI Desktop: From the Home tab, select “New Report” to start creating your live dashboard.
- Choose Visualizations: Explore the visualization options in the Visualizations pane and select the ones that best represent your data. Common choices include line charts for time-series data, gauges for KPIs, and maps for geographic data.
- Design Your Dashboard: Drag and drop your chosen visualizations onto the canvas. Resize and arrange them to create a clear and concise layout. You can also add text boxes, shapes, and images to enhance the dashboard’s visual appeal and provide context.
- Configure Data Sources: For each visualization, set the appropriate data source and fields. If using streaming data, ensure the timestamp field is selected to enable time-based filtering and analysis.
- Set Auto-Refresh: To make your dashboard live, go to the Report settings and enable the “Auto-refresh” option. Specify the refresh interval, which can be as low as every minute for Power BI Pro or Premium licenses.
- Publish: Once you’re satisfied with your dashboard, click “Publish” to upload it to the Power BI service. You can then share the dashboard with your team or organization, allowing them to access it via the Power BI web portal or mobile app.
Enhancing Live Dashboards
- Use Drill-Down Features: Allow users to explore data in more detail by adding drill-down capabilities to your visualizations. This enables them to quickly move from high-level overviews to specific insights with just a few clicks.
- Implement Alerts: Set up alerts to notify users of significant changes in the data. For example, you could alert a manager when sales targets are met or exceeded, or when inventory levels fall below a certain threshold.
- Personalize for Roles: Consider creating role-specific dashboards that display data relevant to different user roles or departments within your organization. This ensures that users see only the information they need, reducing clutter and improving decision-making efficiency.
- Mobile Optimization: Given the time-sensitive nature of live dashboards, ensure they are optimized for mobile devices. This allows users to access critical information and insights on the go.
Use Cases for Real-Time Analytics
Financial Trading
- Real-Time Portfolio Monitoring: Create a live dashboard that displays an investor’s portfolio performance, including real-time stock prices, market trends, and news feeds. This enables investors to make timely decisions and adjust their portfolios accordingly.
Retail
- In-Store Analytics: Retailers can use sensors and cameras to track customer behavior in physical stores, analyzing foot traffic patterns, dwell times, and product interactions. This data can be streamed into Power BI to create live dashboards that help optimize store layouts, promote products, and improve the customer experience.
Manufacturing
- Equipment Monitoring: Manufacturing companies can use IoT sensors to monitor equipment performance in real time. By streaming data on temperature, pressure, and vibration into Power BI, they can create dashboards that detect anomalies, predict equipment failures, and optimize maintenance schedules.
Healthcare
- Patient Monitoring: Hospitals can use real-time analytics to track patient vital signs, bed availability, and emergency room wait times. Live dashboards can help healthcare providers make swift decisions, improve patient care, and optimize resource allocation.
Transportation
- Traffic and Fleet Management: Transportation companies can analyze GPS data from vehicles to monitor traffic conditions, track fleet locations, and optimize routes in real time. Live dashboards can display traffic congestion, vehicle speeds, and delivery ETAs, helping dispatchers and drivers make efficient decisions.
Conclusion
Real-time analytics with Power BI offers organizations a powerful tool to stay agile and responsive in today’s fast-paced business environment. By leveraging streaming data and live dashboards, businesses can make data-driven decisions with minimal delay, identifying trends and anomalies as they happen.With the right implementation and best practices, Power BI’s real-time capabilities can transform how organizations monitor performance, react to market changes, and deliver timely insights to stakeholders. As real-time data becomes increasingly available and valuable, the ability to analyze and act on it will be a key differentiator for businesses seeking to stay ahead of the competition.What are your thoughts on real-time analytics? Can you think of other use cases where streaming data and live dashboards could drive significant value?