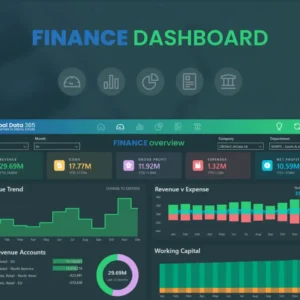
In the modern business landscape, making data-driven decisions is crucial for organizations to gain a competitive edge. This is especially true when it comes to human resources (HR), as people are a company’s greatest asset. HR analytics is the process of collecting, analyzing, and interpreting data about a company’s workforce to drive strategic decision-making. When done right, HR analytics can provide valuable insights that can improve recruitment, employee retention, performance, and overall business outcomes.Microsoft Power BI is a powerful tool that can revolutionize the way HR data is analyzed and presented. With its user-friendly interface and robust features, Power BI enables HR professionals and business leaders to easily explore and visualize workforce data, uncovering patterns and trends that were previously hidden.In this in-depth article, we will delve into the world of HR analytics, providing a step-by-step guide to analyzing workforce data with Power BI. We’ll cover everything from data preparation to advanced analytics techniques, offering practical examples and tips along the way. By the end, you should feel empowered to start leveraging the power of HR analytics in your organization.
Table of Contents
- Understanding the Importance of HR Analytics
- Step-by-Step Guide to Analyzing Workforce Data with Power BI
- Best Practices and Tips for HR Analytics with Power BI
- Taking HR Analytics to the Next Level
- Conclusion and Reflection
Understanding the Importance of HR Analytics
Before we dive into the technical aspects, let’s take a step back and understand why HR analytics is essential.
The Benefits of Data-Driven HR
- Improved Decision-Making— HR analytics provides a factual basis for decision-making. By analyzing data, HR professionals can identify patterns and trends that may otherwise be overlooked. This leads to more informed choices about recruitment, training, performance management, and employee retention.
- Enhanced Employee Experience— Analytics can be used to identify pain points and areas of improvement in the employee lifecycle. For example, data might reveal that certain teams have higher turnover rates, pointing to potential issues with management or company culture. Addressing these issues can lead to a better employee experience.
- Strategic Talent Management— Analytics helps organizations identify their top-performing employees and understand the characteristics that make them successful. This knowledge can then be used to inform recruitment strategies, ensuring that companies hire individuals with the right skills and cultural fit.
- Cost Savings and Efficiency— HR analytics can help organizations optimize their processes, reducing costs and increasing efficiency. For instance, data might show that certain recruitment channels yield higher-quality candidates, allowing companies to allocate their resources more effectively.
Common HR Metrics and KPIs
To set the foundation for effective HR analytics, it’s important to understand the key metrics and key performance indicators (KPIs) commonly used in the field:
- Time to Hire— This metric measures the average number of days it takes to fill a vacant position. It helps identify bottlenecks in the recruitment process and set realistic expectations for hiring managers.
- Cost per Hire— Calculated by dividing the total external and internal recruitment costs by the number of hires made, this KPI provides insight into the efficiency of the recruitment process and the value delivered by the recruitment function.
- Employee Turnover Rate— Turnover rate is the percentage of employees who leave the organization during a specific period. It’s a critical metric for understanding the health of the organization and identifying potential issues with employee retention.
- Training ROI— This metric evaluates the return on investment of training programs. It’s calculated by considering the benefits gained from the training (such as increased productivity or reduced errors) against the costs incurred.
- Absenteeism Rate— This KPI measures the percentage of work hours lost due to unplanned absences. It can indicate issues with employee engagement, health, or workplace environment.
Step-by-Step Guide to Analyzing Workforce Data with Power BI
Now, let’s get into the practical aspects of using Power BI for HR analytics. We’ll walk through each step, from data preparation to visualization and advanced analytics.
Step 1: Identify Data Sources and Collect Data
The first step is to identify the data sources that contain valuable HR information. These might include HR management systems, payroll software, performance management tools, employee engagement survey results, and more. It’s important to involve the relevant stakeholders (such as IT and data owners) to ensure you have access to the data and understand its structure.Example: For this article, let’s pretend we are a retail company with stores across the country. We want to analyze our employee turnover data to identify any patterns or issues. Our data sources might include an HR database that contains employee demographics and employment status, as well as a payroll system that tracks employee salaries and bonuses.
Step 2: Clean and Prepare Data
Once you’ve gathered your data, it’s time to clean and prepare it for analysis. This step is crucial, as it ensures the accuracy and consistency of your data. Use data cleaning techniques to handle missing values, duplicate entries, and outliers. Standardize data formats and create calculated fields to derive meaningful insights.Example: In our turnover data, we might find that employee status is recorded inconsistently, with some entries saying “Terminated” and others “Left.” We would need to clean this data by creating a new field that standardizes these values (e.g., “Terminated”). We might also need to create a calculated field to determine the length of employment, as this could be a factor in turnover rates.
Step 3: Load Data into Power BI
Power BI provides several options for loading data, depending on the source and format. You can connect directly to a wide range of data sources, including Excel sheets, databases, and cloud-based services. Power BI also allows you to import data from flat files or use the Power Query Editor to transform and shape your data before loading it into the model.Example: For our analysis, we’ll connect Power BI directly to our HR database and payroll system. We’ll use the Power Query Editor to clean and transform the data, creating a single dataset that combines information on employee demographics, employment status, and salary details.
Step 4: Build Visualizations and Dashboards
Now the fun part begins! Power BI offers a wide range of visualization options, from simple bar charts to interactive maps. Start by exploring the relationships in your data and choosing the right visuals to convey your message. Build dashboards that provide insights into key HR metrics and KPIs.Example: To analyze our turnover data, we might create a bar chart that compares turnover rates by department, a map that visualizes turnover rates by store location, and a scatter plot that explores the relationship between employee tenure and turnover. We can then bring these visuals together on a dashboard, providing an at-a-glance view of turnover trends.
Step 5: Perform Advanced Analytics
Power BI provides advanced analytics capabilities that go beyond basic visualizations. With features like quick measures, clustering, and forecasting, you can uncover deeper insights from your data.Example: We could use the “forecast” feature in Power BI to predict future turnover rates based on historical data. This would help us anticipate potential issues and plan accordingly. We might also use clustering to identify groups of employees with similar characteristics and turnover patterns, helping us understand the factors that influence retention.
Step 6: Share and Collaborate
Power BI makes it easy to share insights with stakeholders and collaborate on reports and dashboards. You can publish and distribute content through the Power BI service, ensuring that everyone involved has access to the same up-to-date information.Example: We could share our turnover analysis dashboard with the executive team, store managers, and HR business partners. This would enable them to monitor turnover trends, identify areas of concern, and work together to implement retention strategies.
Best Practices and Tips for HR Analytics with Power BI
Here are some additional tips and best practices to keep in mind as you embark on your HR analytics journey with Power BI:
- Data Security and Privacy— Ensure that you have the appropriate data governance practices in place. Only share data that is necessary for the analysis, and be mindful of sensitive employee information. Power BI offers role-level security and data protection features to help secure your data.
- Data Modeling— Take the time to structure your data model effectively. This includes creating relationships between tables, using star or snowflake schemas, and defining calculations and measures. A well-designed data model will make your reports and dashboards more efficient and easier to maintain.
- Self-Service BI— Empower your HR team and business users to explore data on their own. Provide training and guidance on how to use Power BI effectively, and consider creating templates or pre-built reports that users can customize for their specific needs.
- Storytelling with Data— Visualizations are most impactful when they tell a story. As you build your dashboards, think about the narrative you want to convey. Use tooltips, annotations, and report page tooltips to provide additional context and guide users through your analysis.
Taking HR Analytics to the Next Level
As you become more comfortable with Power BI and HR analytics, there are even more advanced techniques you can explore:
- Machine Learning— Power BI integrates with Azure Machine Learning, enabling you to leverage predictive analytics and machine learning models within your HR analytics. This opens up possibilities for sentiment analysis in employee surveys, churn prediction, and talent acquisition optimization.
- Natural Language Processing— Power BI’s natural language capabilities allow users to ask questions of their data in plain English and receive instant visualizations as responses. This makes data exploration more accessible and intuitive for non-technical users.
- Real-Time Analytics— Power BI can connect to streaming data sources, providing real-time insights into your workforce. This could include analyzing employee sentiment in real-time or monitoring attendance patterns to identify potential issues promptly.
Conclusion and Reflection
HR analytics is a powerful tool for any organization, and Power BI makes it accessible and user-friendly. By following the steps outlined in this article, you can begin to unlock valuable insights from your workforce data. Remember that HR analytics is an ongoing process—continually seek feedback, iterate on your dashboards, and explore new data sources to drive continuous improvement.As you reflect on what you’ve learned, consider the following question: How can you use HR analytics to drive positive change in your organization? What specific actions or initiatives might you propose based on the insights gained from your Power BI analysis?I hope this article has inspired and equipped you to embark on your HR analytics journey. Now it’s time to roll up your sleeves and dive into your own workforce data!
