Introduction
Power BI by Microsoft is a powerful tool for data visualization and business intelligence. It enables users to create insightful reports and dashboards to make data-driven decisions. One of the most unique and powerful features of Power BI is its Q&A functionality, which allows users to ask natural language questions about their data and receive visual responses. The Q&A feature sets Power BI apart from traditional business intelligence tools by offering a more intuitive and conversational approach to data analysis. It empowers users, especially those without a technical background, to explore and interact with data easily. This guide will take you through the ins and outs of the Q&A feature, providing an in-depth understanding of how to use it effectively and enhance your data analysis capabilities with Power BI.
Understanding the Q&A Feature
The Q&A feature in Power BI is a natural language processing (NLP) tool that enables users to ask questions about their data in plain English (or their chosen language) and receive meaningful answers in the form of visualizations, tables, or quick insights. At its core, Q&A is designed to be a intuitive and user-friendly way to interact with your data. Instead of creating complex queries or learning specific functions, you can simply ask questions as you would in a conversation. For example, you can ask, “What were our total sales last quarter?” or “Show me the breakdown of expenses by category this year.” The Q&A feature then interprets your question, understands the intent, and retrieves the relevant data to provide a visual response. It can read and interpret various types of queries, including:
- Simple questions: e.g., “What is the average revenue per customer?”
- Comparative questions: e.g., “How do this month’s sales compare to last month’s?”
- Filtering and slicing: e.g., “Show me sales by region for the top 5 products.”
- Time-based queries: e.g., “What was our quarterly growth rate over the last 2 years?”
- Conditional questions: e.g., “Which products have a higher profit margin than 20%?”
Enabling and Setting Up Q&A
To start using the Q&A feature, ensure that it is enabled for your Power BI report. When you publish a report to the Power BI service, Q&A is automatically enabled. However, if you are working in Power BI Desktop, you need to manually turn it on. Here’s how:
- Open your report in Power BI Desktop.
- Go to the “File” menu and select “Options and settings.”
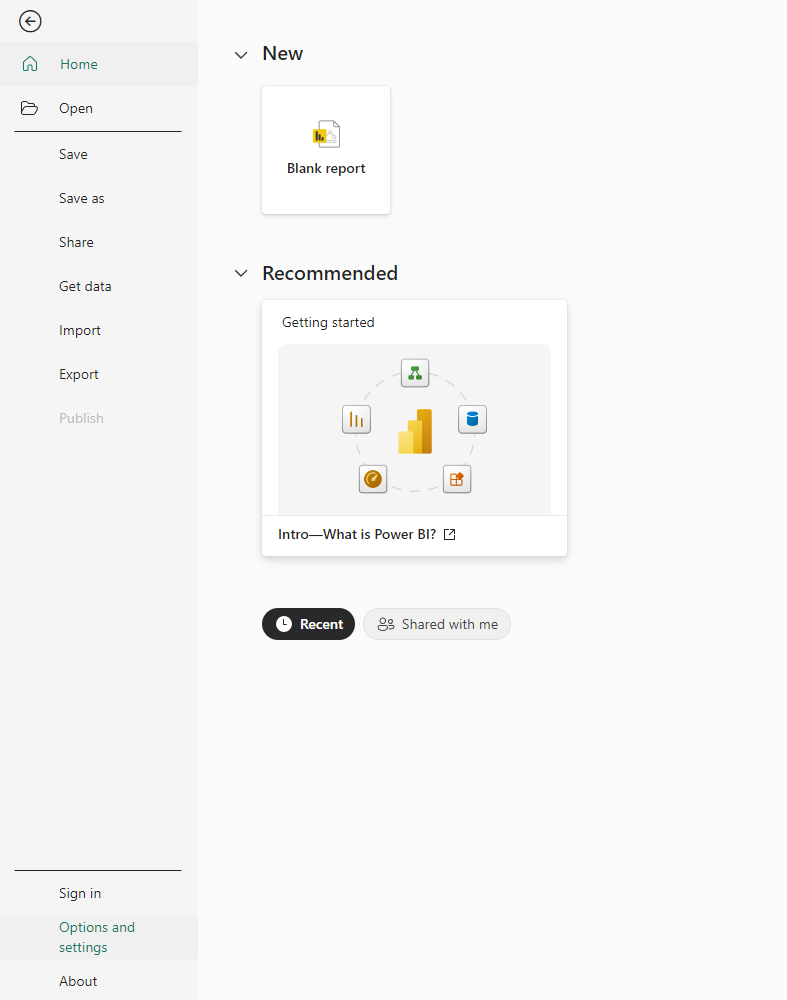
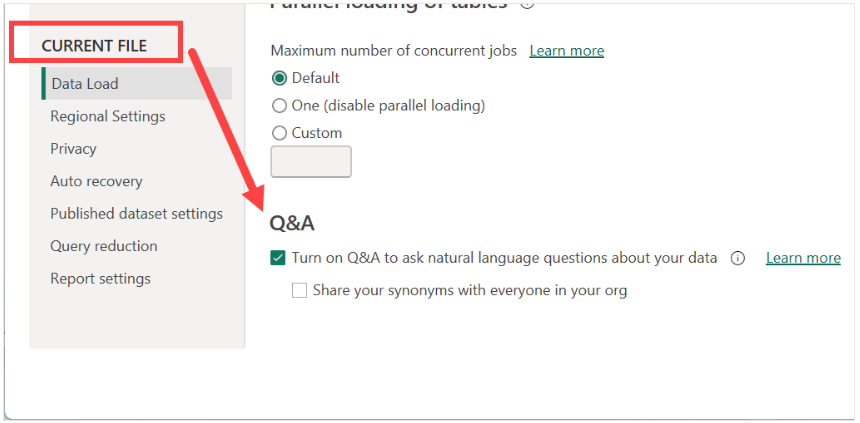
- Choose “Options,” then select the “Current file” tab.
- Under “Current file,” find the “Enable Cortana and Q&A” section and ensure the checkbox is selected.
- Click “OK” to save the changes.
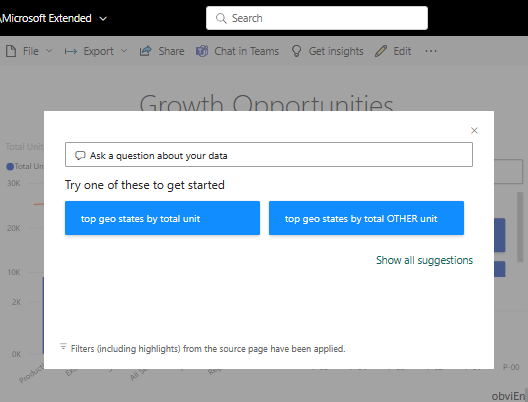
 Once Q&A is enabled, you can start asking questions. The Q&A visual will appear as a blank box with a text cursor, usually at the top or side of your report page. You can type or paste your question into this box. It’s important to note that the effectiveness of Q&A depends on how well it understands the language and structure of your data. Therefore, proper data preparation and modeling are crucial steps before using Q&A. Ensure that your column names, measures, and hierarchies are named clearly and logically. For example, instead of a column named “Amt,” rename it to “Sales Amount” to provide more context. Similarly, ensure that date columns are formatted correctly, and that your data model includes appropriate relationships and hierarchies. You can also teach Q&A by providing synonyms and teaching it how to interpret certain terms. We will cover this in more detail later in the guide.
Asking Questions: The Basics
Let’s start with the basics of asking questions in Q&A. Here are some simple guidelines to follow:
- Start with a question word: Begin your query with words like “What,” “How many,” “Show me,” etc. For example, “What are our total expenses for this quarter?”
- Use clear and concise language: Ask your question as you would in a conversation, but try to be specific and concise. Avoid vague or ambiguous phrases.
- Refer to data by their names: Use the exact names of columns, measures, or dimensions as they appear in your dataset. For example, “total sales” or “profit margin.”
- Use filtering and slicing: You can filter your results by adding conditions to your question. For instance, “Show me sales by region for the top 3 products.”
- Explore with related questions: Q&A often suggests related questions or refinements. These suggestions can help you explore your data further.
Here’s a basic example: Let’s say you have a report with sales data, including columns for “Region,” “Product,” “Sales Amount,” and “Profit.” You can ask questions like:
- “What were our total sales last month?”
- “Show me the top 5 products by sales in the East region.”
- “How does this month’s profit compare to the previous month?”
Advanced Query Techniques
While the basics of asking questions are straightforward, Q&A also supports more advanced query techniques. Here are some ways to enhance your queries:
- Comparative Questions: You can ask comparative questions to analyze changes or differences. For example, “How do this year’s sales compare to last year’s?” or “Which region has the highest sales growth?”
- Time-based Queries: Q&A understands various time-based queries. You can ask questions like “Show me monthly sales for the last quarter” or “What was our quarterly growth rate over the last 3 years?”
- Conditional Questions: You can use conditions in your queries, such as “Show me products with a profit margin higher than 20%” or “Which regions have sales below the average.”
- Calculations and Aggregations: Q&A can perform calculations and aggregations. For instance, “What is the average sales amount per customer?” or “Calculate the sum of sales by region.”
- Drilling Down: You can drill down into specific data points. For example, “Show me sales by month for the East region in Q3.”
Example: You can ask more complex questions, such as “What is the year-over-year growth rate for each region in the last 2 years?” or “Calculate the average profit margin for products with sales above $100,000.”
Visualizing Results
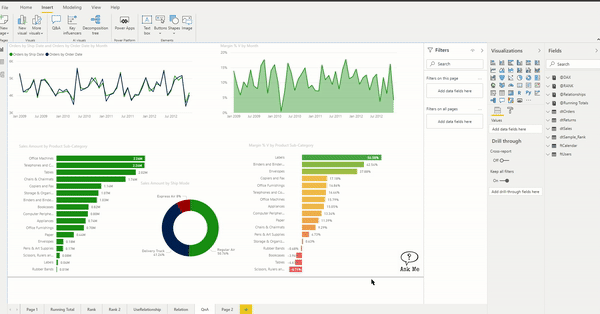
One of the most powerful aspects of Q&A is its ability to visualize the answers to your questions. Depending on the nature of your query, Q&A will present the results in the most appropriate visual format. Here’s what you should know:
- Automatic Visualization: Q&A chooses the best visualization based on the type of question and data. For instance, a question about sales over time might result in a line chart, while a question about the top products might yield a bar chart.
- Customizing Visuals: You can customize the visuals generated by Q&A. Simply click on the “Visualizations” pane and make the desired changes, such as changing the chart type or adding data colors.
- Quick Insights: Q&A can also provide quick insights, which are automatically generated visualizations that highlight trends or patterns in your data. These insights can be accessed by clicking the lightbulb icon in the Q&A box.
- Pinning Visuals: If you’re happy with the visualization generated by Q&A, you can pin it to your report canvas by clicking the pin icon. This adds the visual as a standard report element that you can further customize or interact with.
Example: You ask, “How do our sales vary by region?” Q&A might generate a map visualization, coloring each region by its sales amount. If you then ask, “What is the sales trend over time for the East region?” Q&A might switch to a line chart, showing the sales trend for that specific region.
Teaching Q&A
One of the unique capabilities of Power BI’s Q&A is the ability to teach it and improve its understanding of your data. This feature ensures that Q&A becomes more accurate and tailored to your specific dataset and terminology. Here’s how you can teach Q&A:
- Synonyms: You can provide synonyms for column names or measures to improve understanding. For example, you can teach Q&A that “revenue” is a synonym for “sales.”
- Teach Terms: If Q&A doesn’t understand a specific term, you can teach it by providing a definition. For instance, if you use the term “COGS,” you can define it as “cost of goods sold.”
- Suggested Questions: Q&A can suggest questions based on your data. You can edit these suggestions to provide more relevant queries.
- Data Category: Properly setting the data category (e.g., date, geography, etc.) helps Q&A interpret and visualize data correctly.
- Add a Corpus: You can add a corpus, which is a collection of terms and phrases, to improve Q&A’s understanding of industry-specific jargon or unique terminology used in your organization.
To access these teaching features, click on the gear icon in the Q&A box, then select “Teach Q&A.” Here, you can make the necessary adjustments to improve Q&A’s performance.
Best Practices and Tips
Here are some best practices and tips to get the most out of the Q&A feature:
- Data Preparation: Ensure your data is clean, consistent, and well-structured. Proper data modeling, including clear column names and defined relationships, is crucial for effective Q&A.
- Test and Refine: Regularly test and refine your Q&A experience. Ask a variety of questions to identify areas where Q&A might need improvement, and then use the teaching features to enhance its understanding.
- Encourage User Feedback: If you share your reports with others, encourage users to provide feedback on the Q&A experience. This can help identify areas where the feature might be falling short or where improvements can be made.
- Monitor Usage: Power BI provides usage metrics for your reports. Monitor how users are interacting with Q&A to gain insights and make necessary adjustments.
- Security and Privacy: Be mindful of data security and privacy when using Q&A. Ensure that only authorized users have access to sensitive data.
- Mobile Experience: Consider the mobile experience when designing reports with Q&A. Ensure that visualizations generated by Q&A are optimized for different screen sizes and devices.
Common Challenges and Troubleshooting
While Q&A is a powerful feature, it’s not without its challenges. Here are some common issues and how to address them:
- Unclear or Vague Questions: Q&A might struggle with ambiguous or vague questions. Ensure your queries are specific and clear, referring to data by their exact names.
- Data Modeling Issues: Poor data modeling can hinder Q&A’s performance. Ensure your data is structured logically, with clear relationships and hierarchies.
- Inconsistent Results: In some cases, Q&A might provide inconsistent results. This could be due to data modeling issues or a lack of understanding of your data. Regularly teaching and refining Q&A can help address this.
- Unsupported Visuals: Not all types of visuals are supported by Q&A. If you require a specific visual type, you might need to create it manually or pin a Q&A-generated visual and customize it further.
- Performance Issues: Large datasets or complex queries might impact performance. Consider optimizing your data model or using data aggregation techniques to improve query speed.
Real-World Use Cases
The Q&A feature in Power BI has been utilized across various industries to drive data-driven decision-making. Here are some real-world use cases:
- Retail: A retail chain uses Q&A to analyze sales data, identify top-performing products, and compare performance across different regions and time periods. This helps them optimize inventory and marketing strategies.
- Healthcare: A healthcare provider uses Q&A to track patient outcomes and identify trends in treatment effectiveness. This enables them to improve patient care and allocate resources efficiently.
- Finance: A financial services company uses Q&A to monitor investment portfolio performance, compare different investment strategies, and identify areas for improvement in risk management.
- Manufacturing: A manufacturing company uses Q&A to analyze production data, identify bottlenecks, and optimize processes to increase efficiency and reduce costs.
- Education: An educational institution uses Q&A to track student performance, identify at-risk students, and analyze the effectiveness of different teaching methods.
Conclusion and Next Steps
Power BI’s Q&A feature is a powerful tool that transforms how users interact with data. By enabling natural language queries, it empowers users to explore and gain insights from their data without the need for complex query languages or technical expertise. In this guide, we’ve covered the basics of using Q&A, including how to ask questions, visualize results, and teach Q&A to improve its understanding. We’ve also provided best practices, tips, and real-world use cases to help you leverage this feature effectively. As a next step, we encourage you to start experimenting with Q&A in your own Power BI reports. Test the feature with different types of questions, explore the suggested refinements, and provide feedback to improve its performance. Question for Users: How do you see the Q&A feature benefiting your specific use case or industry? What potential challenges or limitations do you foresee, and how might they be addressed?