Introduction
In the modern business landscape, understanding customer sentiment is vital for success. The ability to analyze customer feedback and discern their feelings about your products or services can provide a competitive edge. This article delves into how to analyze customer feedback and sentiment using Power BI, a robust business analytics tool. We will cover everything from data collection to advanced sentiment analysis, providing you with a comprehensive guide to harnessing this powerful tool.
The Importance of Analyzing Customer Feedback and Sentiment
Customer feedback is an invaluable resource that can inform a multitude of business decisions. It helps you understand what your customers like, what they dislike, and what they expect from your brand. Sentiment analysis goes a step further by determining the emotional tone behind customer feedback. This can help you:
- Improve customer satisfaction
- Enhance product development
- Optimize marketing strategies
- Increase customer retention
Why Choose Power BI for Customer Feedback and Sentiment Analysis?
Microsoft Power BI is a leading business analytics tool that allows you to visualize your data and share insights across your organization. Its integration capabilities, user-friendly interface, and powerful data processing features make it ideal for analyzing customer feedback and sentiment.
Key Features of Power BI
- Data Integration: Connects to various data sources such as Excel, SQL Server, and web APIs.
- Data Transformation: Power Query allows you to clean and prepare your data for analysis.
- Visualization: Create interactive dashboards and reports to visualize your data.
- Collaboration: Share insights and collaborate with team members in real-time.
Step-by-Step Guide to Analyzing Customer Feedback and Sentiment with Power BI
Step 1: Collecting Customer Feedback Data
The first step in analyzing customer feedback is data collection. Customer feedback can be gathered from various sources, including:
- Surveys: Use tools like SurveyMonkey or Google Forms to collect structured feedback.
- Social Media: Extract comments, mentions, and reviews from platforms like Twitter, Facebook, and Instagram.
- Product Reviews: Gather reviews from e-commerce sites like Amazon and eBay.
- Emails and Support Tickets: Collect feedback from customer support interactions.
Example of Data Collection
Let’s assume we are analyzing feedback for a retail company. We collect survey responses, social media comments, and product reviews. The data is then consolidated into a single dataset.
Step 2: Preprocessing the Data
Before analyzing the data, it needs to be cleaned and formatted. Power Query in Power BI is an excellent tool for this purpose. Preprocessing steps include:
- Removing Duplicates: Ensure each piece of feedback is unique.
- Handling Missing Values: Fill or remove missing data points.
- Standardizing Formats: Ensure dates, numbers, and text are in a consistent format.
- Tokenizing Text: Break down text data into individual words or phrases for analysis.
Example of Preprocessing
In our retail company example, we use Power Query to remove duplicate entries, fill missing values, and standardize the date format across all feedback sources.

Step 3: Performing Sentiment Analysis
With the data preprocessed, the next step is to perform sentiment analysis. This involves determining whether the feedback is positive, negative, or neutral. Power BI can integrate with Azure Cognitive Services to perform this analysis.
- Set Up Azure Cognitive Services: Create an Azure account and set up the Text Analytics API.
- Connect Power BI to Azure: Use the API key to connect Power BI to Azure Cognitive Services.
- Analyze Sentiment: Apply the sentiment analysis function to your dataset.
Example of Sentiment Analysis
Using Azure Cognitive Services, we analyze the sentiment of the retail company’s feedback data. The API returns a sentiment score for each feedback entry, which we categorize as positive, negative, or neutral.
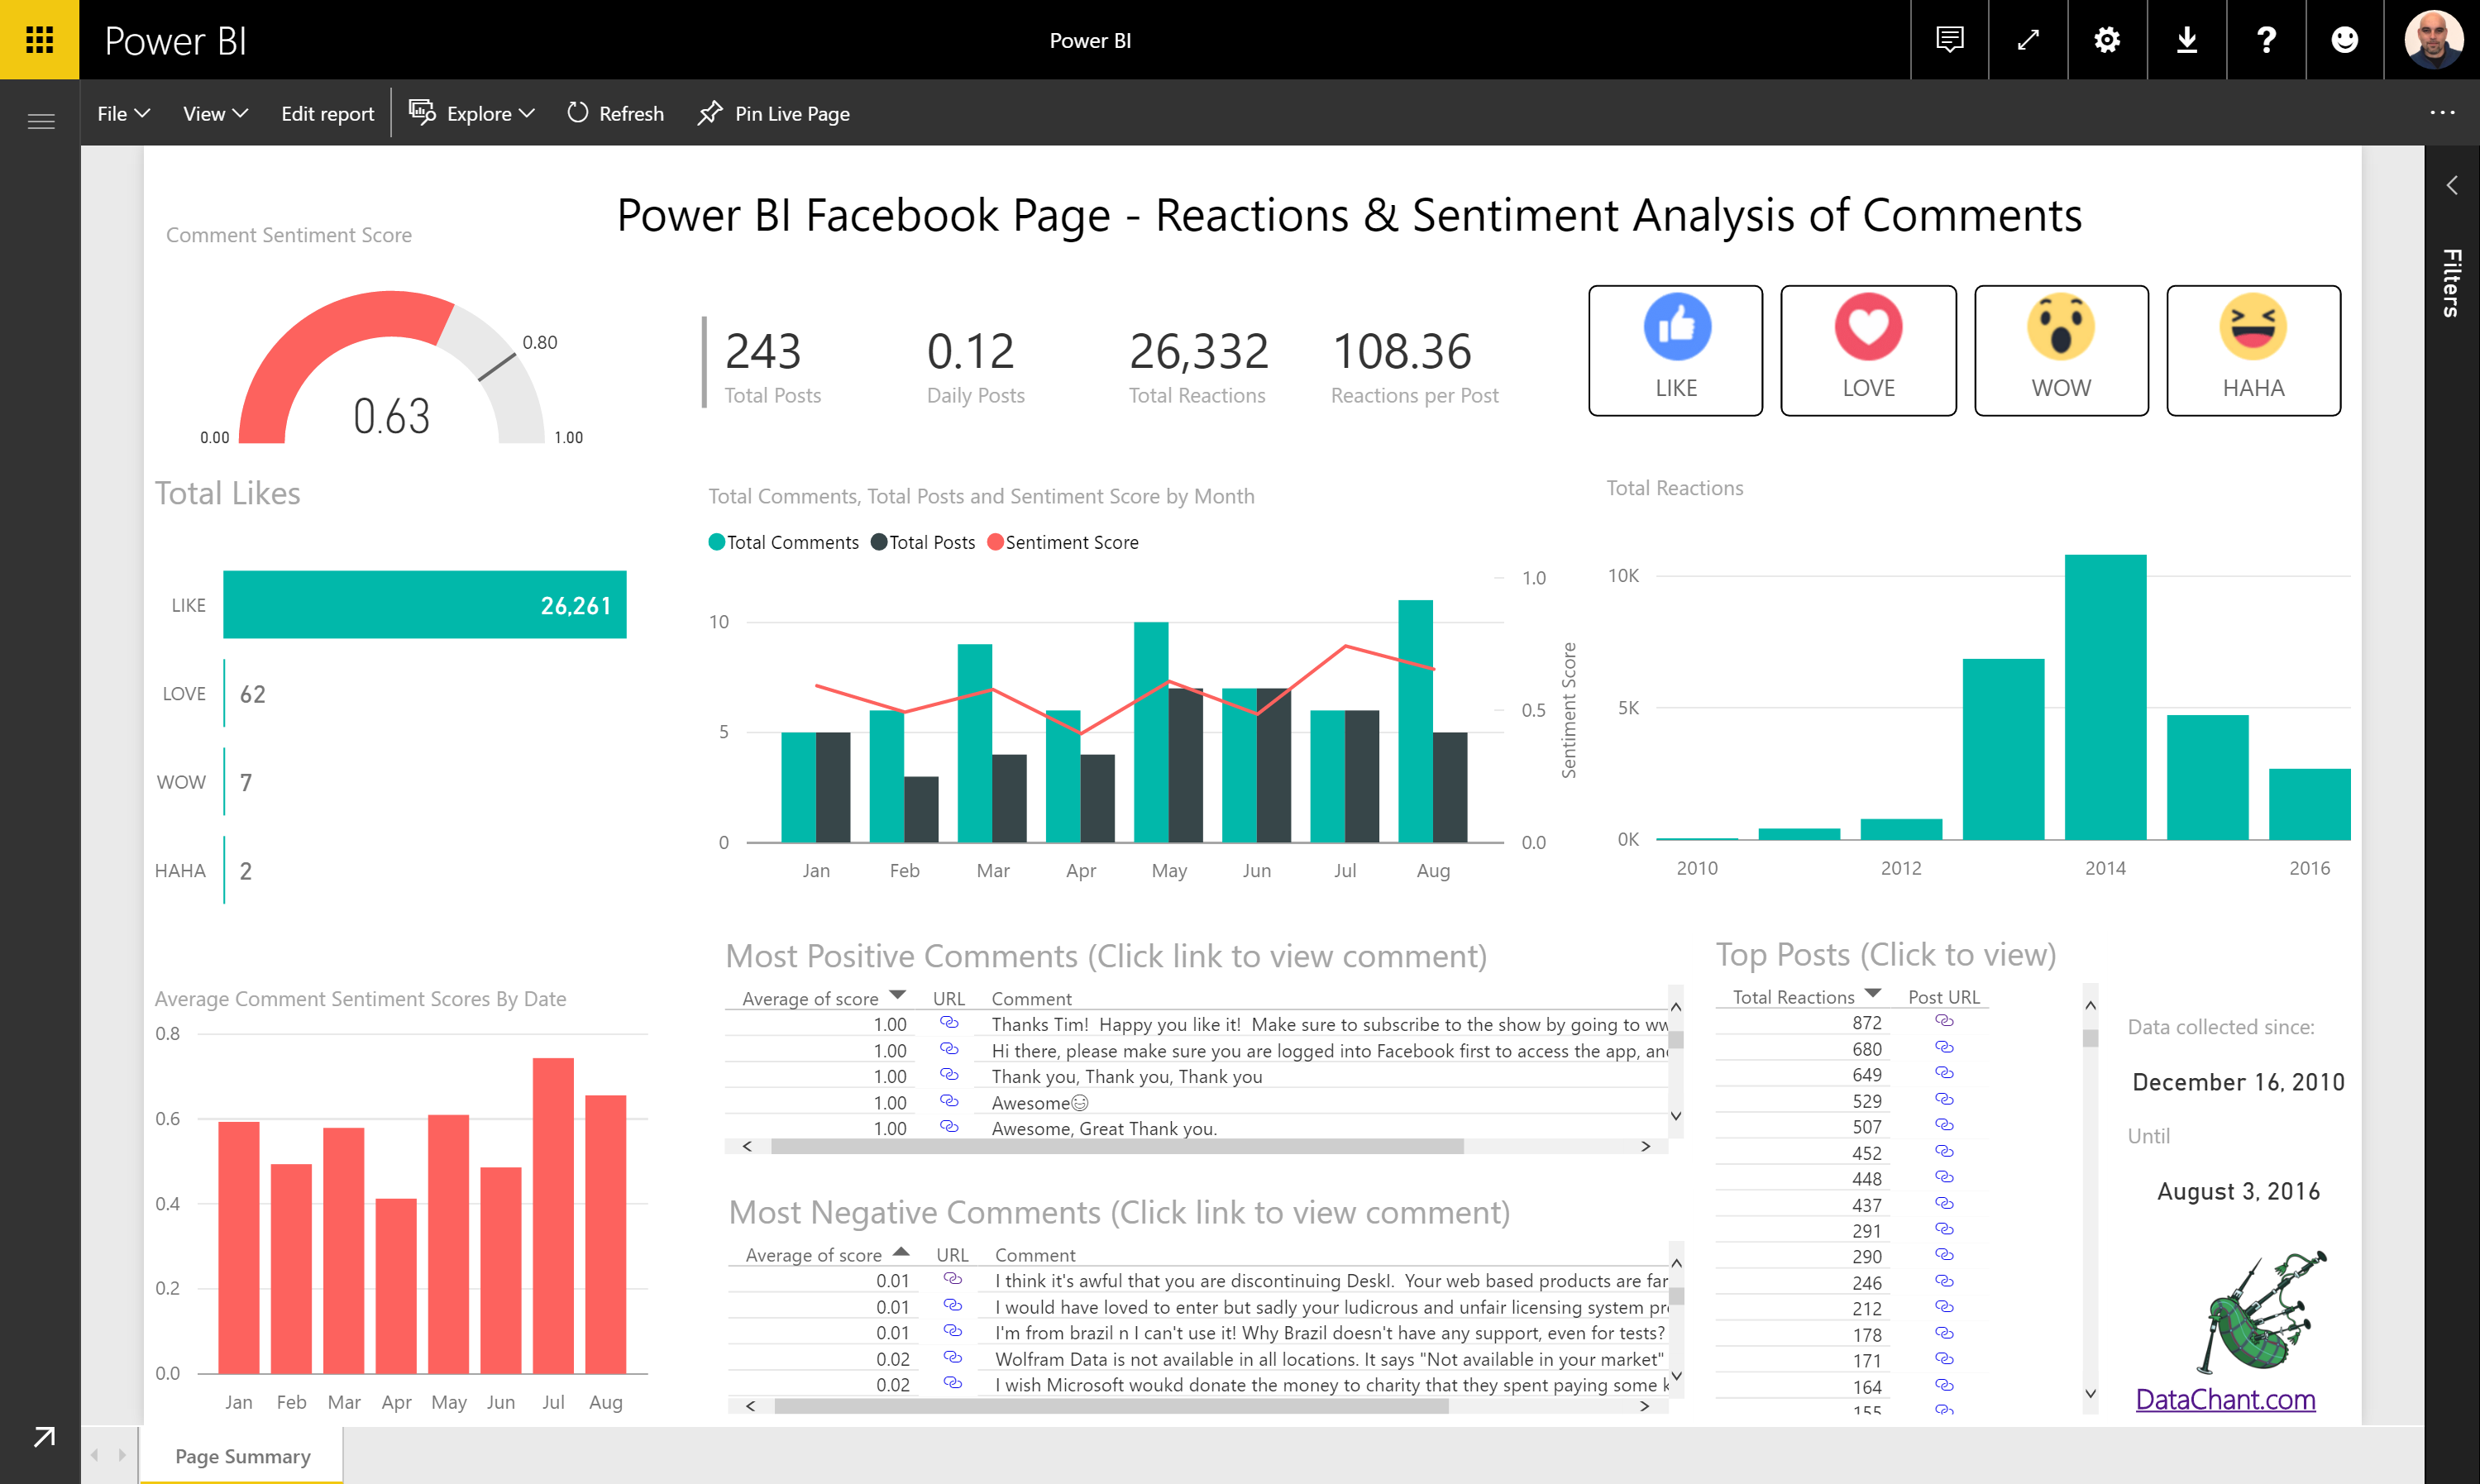
Step 4: Visualizing the Data
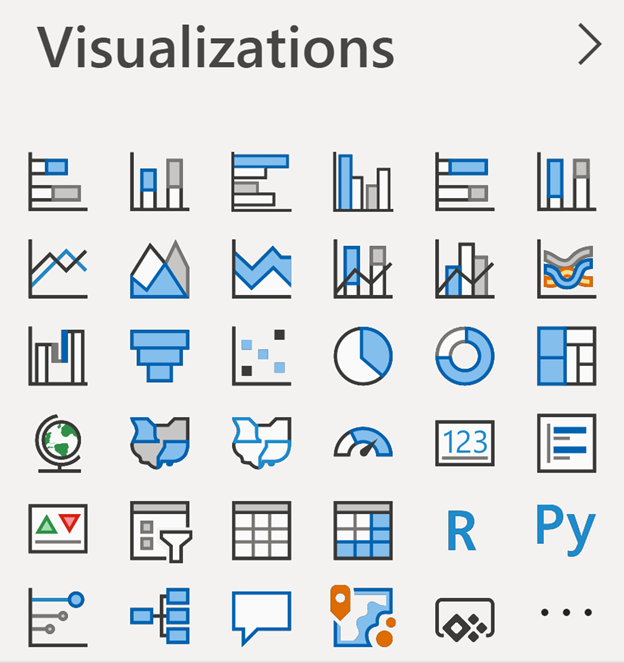
Visualization is a critical component of data analysis. Power BI offers a range of visualization options to help you make sense of your data. Some useful visuals for sentiment analysis include:
- Pie Charts: Show the proportion of positive, negative, and neutral feedback.
- Bar Charts: Compare sentiment across different products or time periods.
- Word Clouds: Highlight common words and phrases in customer feedback.
- Heat Maps: Visualize sentiment trends over time or across geographic locations.

Example of Visualization
For the retail company, we create a dashboard with the following visuals:
- A pie chart showing the overall sentiment distribution.
- A bar chart comparing sentiment across different product categories.
- A word cloud highlighting common positive and negative phrases.
- A heat map showing sentiment trends over the past six months.
Step 5: Gaining Insights and Taking Action
The final step is to interpret the visualizations and derive actionable insights. This involves identifying trends, patterns, and anomalies in the data. Key questions to ask include:
- What are the common themes in positive and negative feedback?
- Which products or services receive the most negative feedback?
- Are there seasonal trends in customer sentiment?
- How does sentiment vary across different customer segments?
Example of Insights and Actions
For the retail company, we find that negative feedback is primarily related to shipping delays and customer service issues. Positive feedback often mentions product quality and variety. Based on these insights, the company decides to:
- Improve logistics to reduce shipping times.
- Invest in customer service training.
- Highlight product quality and variety in marketing campaigns.
Conclusion
Analyzing customer feedback and sentiment with Power BI provides invaluable insights that can drive business improvements and customer satisfaction. By following the steps outlined in this guide, you can harness the power of Power BI to transform raw feedback into actionable insights. How has your organization used Power BI to analyze customer feedback and sentiment? What insights have you gained, and how have they influenced your business strategies? Share your experiences and thoughts in the comments below.