Introduction
Power BI is an incredibly powerful tool for data visualization and business intelligence. With its user-friendly interface and robust features, Power BI allows beginners and experts alike to transform data into actionable insights. However, getting started with any new software can be daunting. This comprehensive guide will take you on a journey through Power BI, offering tips, tricks, and best practices to help beginners master the art of data analysis and visualization.
What is Power BI?
Developed by Microsoft, Power BI is a collection of software services, apps, and connectors that work together to turn data from various sources into interactive visuals. It simplifies the process of creating dashboards, reports, and datasets, enabling users to make data-driven decisions with ease. Power BI’s versatility allows individuals and businesses to connect to hundreds of data sources, from Excel spreadsheets to cloud-based services like Google Analytics and Salesforce. One of Power BI’s standout features is its ability to handle large volumes of data and perform complex data modeling. This makes it a popular choice for businesses that need to analyze and make sense of vast amounts of information. With Power BI, users can quickly identify trends, track KPIs, and create dynamic reports that provide valuable insights for decision-making.
Why Use Power BI?
Power BI has become a go-to tool for data analysts, business users, and even individuals due to its wide range of benefits:
- Data Visualization Excellence: Power BI offers a vast array of visual options, including charts, maps, and custom visuals, enabling users to present data in engaging and informative ways.
- Connectivity & Data Sources: With support for over 70 data sources, Power BI allows users to connect to and analyze data from almost any system or platform, ensuring flexibility and compatibility.
- Data Modeling & Transformation: Power BI’s data modeling capabilities allow users to create robust data models, transform and clean data, and establish relationships between datasets for accurate analysis.
- Interactive Reports & Dashboards: Users can create dynamic reports and dashboards that update in real time, providing a single source of truth for organizations and enabling quick identification of trends and anomalies.
- Quick Insights: Power BI’s AI-powered Quick Insights feature automatically highlights trends and patterns in data, helping users uncover valuable insights without manual analysis.
- Scalability & Collaboration: Power BI scales to meet the needs of individuals and enterprises, offering collaboration features like shared workspaces and the ability to publish and share reports securely.
Tips and Tricks for Beginners
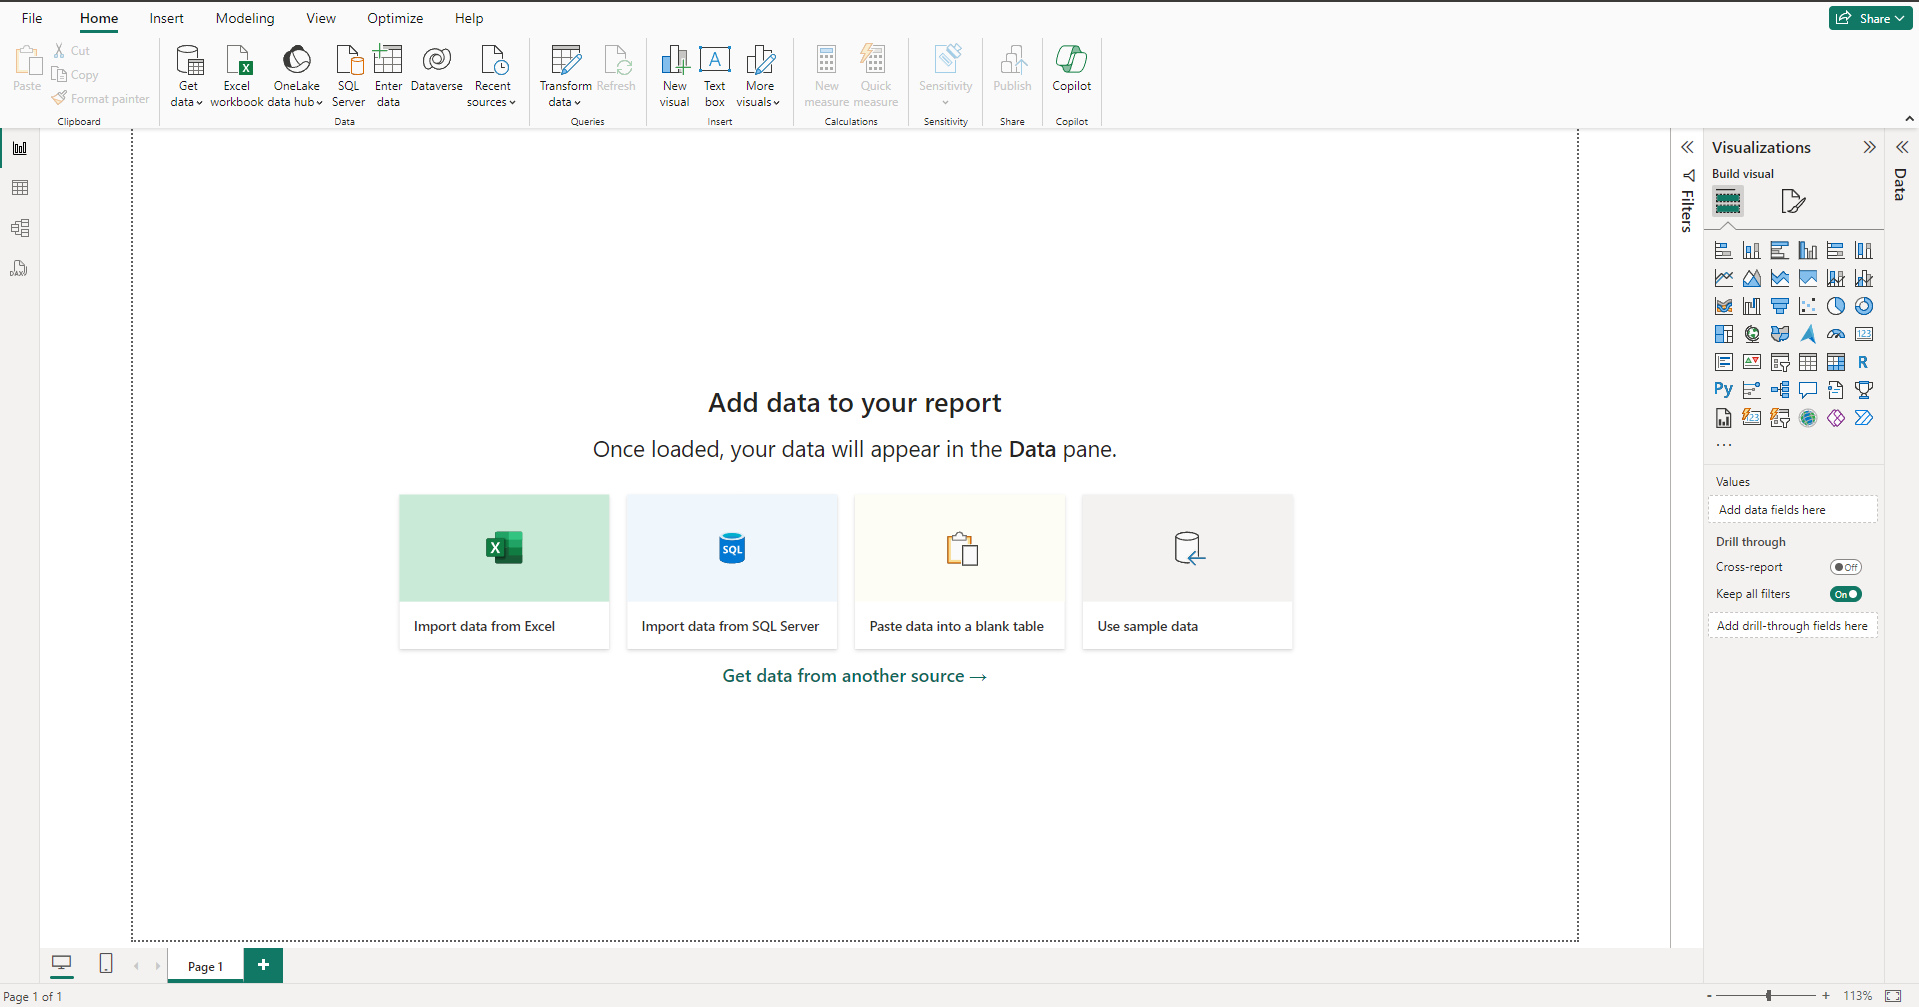
1. Getting Started: Navigating the Power BI Interface
When you first open Power BI, you’ll be greeted by a dashboard, which is the canvas where you create and view reports. The interface might seem overwhelming at first, but it’s quite intuitive. Here are some tips to help you navigate:
- Ribbon: The ribbon at the top provides quick access to common tasks like importing data, formatting visuals, and adding filters.
- Report View/Data View: You can switch between Report View (where you design visuals) and Data View (where you can view and edit data) using the icons in the top-right corner.
- Fields, Visualizations, and Filters Panes: On the right, you’ll find these three panes. Fields are the data elements you can use in visuals, Visualizations is where you design and customize charts/graphs, and Filters allow you to narrow down data.
- Canvas: This is the main work area where your visuals and reports come to life.
- Page and Report Navigation: At the bottom, you can switch between different pages of your report and navigate through the pages of your dashboard.
2. Importing and Connecting to Data
One of Power BI’s strengths is its ability to connect to a multitude of data sources. Here’s how you can get started:
- Excel Workbooks: If you’re already working with data in Excel, simply import your workbook into Power BI. You can connect to data in tables or use the Power Query Editor to transform and shape your data before loading it into Power BI.
- Databases: Power BI supports connections to various databases like SQL Server, Oracle, and Access. You’ll need the server name, database name, and credentials to connect.
- Web Sources: Connect to data on the web, like Google Analytics or Salesforce. Power BI will guide you through the authentication process and allow you to select specific tables or entire datasets.
- Other Sources: Power BI also supports text files, CSVs, SharePoint lists, and more. The “Get Data” option in the ribbon is your gateway to all these sources.
Example: Let’s say you want to analyze sales data stored in a SQL Server database. You would choose “SQL Server” from the data source options, enter the server details, and select the specific database and tables containing your sales data.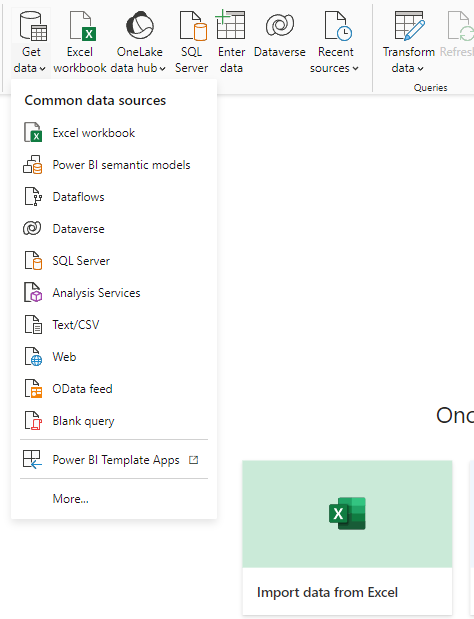
3. Shaping and Transforming Data with Power Query
Once you’ve connected to your data source, it’s time to shape and transform it to fit your needs:
- Power Query Editor: This is where the magic happens. Click “Edit Queries” to open the editor and view/edit the steps Power BI took to import your data.
- Common Transformations: Use the ribbon and right-click menu to perform tasks like renaming columns, changing data types, splitting columns, and pivoting tables.
- Creating Custom Columns: If you need to derive new values, you can add custom columns using the “Add Column” tab. This allows you to perform calculations or combine data from multiple columns.
- M Query Language: For more advanced users, you can use the M query language to write custom transformations and logic.
Example: You have a table with customer data, but the “Address” column contains both street addresses and P.O. boxes in the same field. You can use the “Split Column” feature to separate the street address and P.O. box into two columns, making it easier to analyze and filter.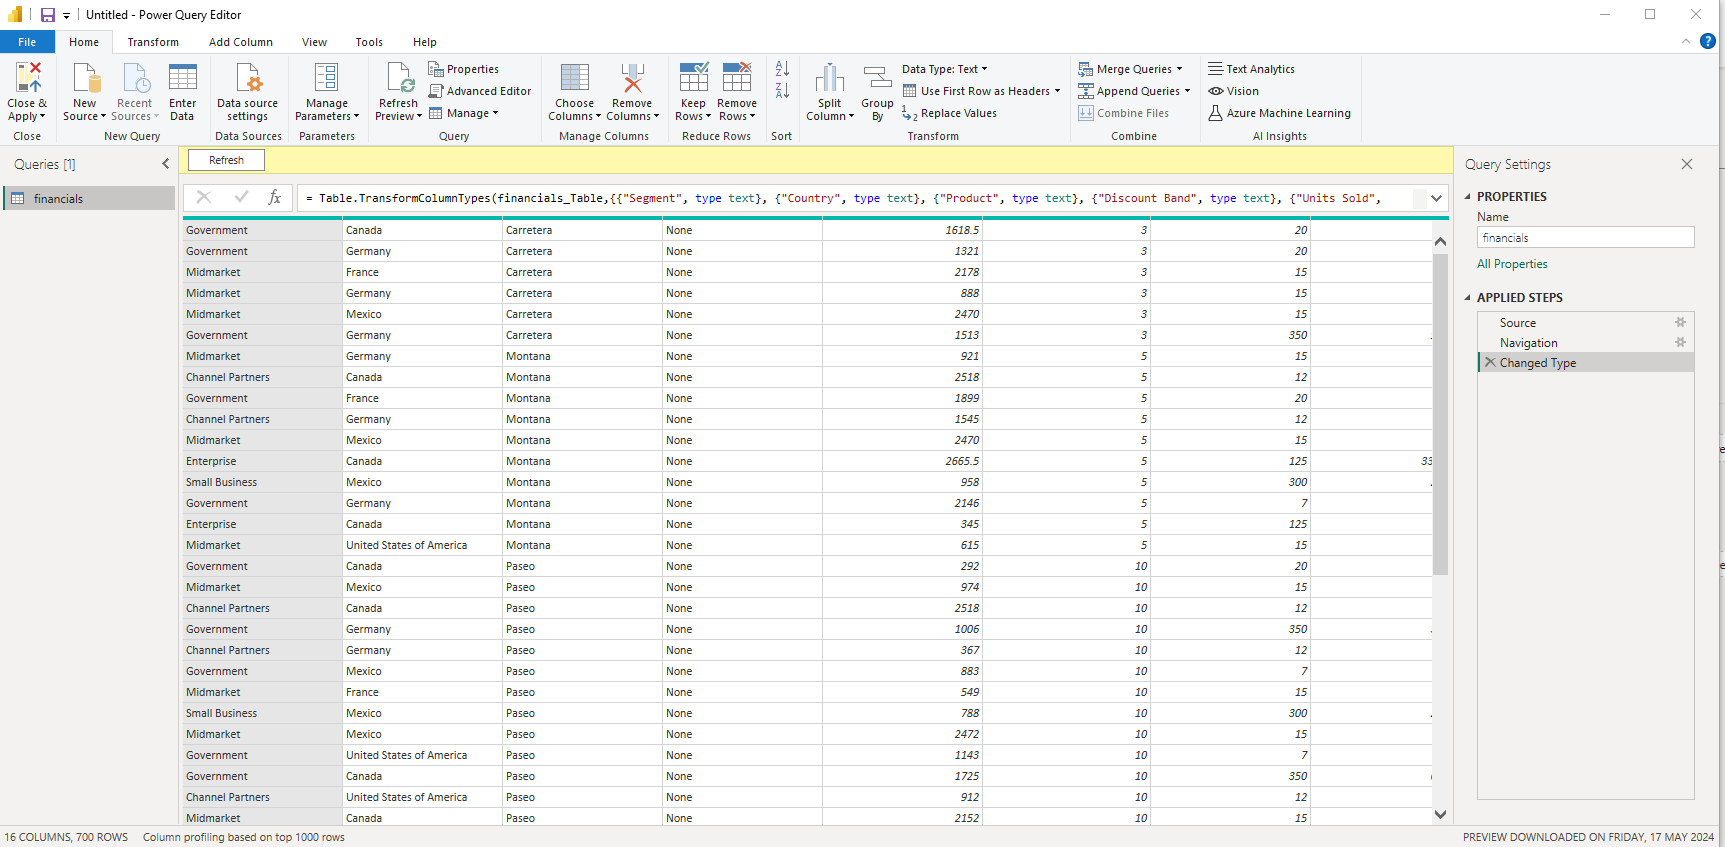
4. Building Your First Report
Now for the fun part – creating visuals and building your report:
- Choosing Visuals: Power BI offers a wide range of visual options, from basic charts and graphs to maps, gauges, and custom visuals. Select the type of visual you want from the “Visualizations” pane, then drag and drop fields to populate it with data.
- Formatting: Make your visuals pop by formatting their appearance. You can change colors, add data labels, adjust axis settings, and more using the “Format” tab in the ribbon or the formatting options in the “Visualizations” pane.
- Drill Down and Cross-Filtering: Enable drill-down capabilities to let users explore data at different levels of detail. You can also use cross-filtering to have selections in one visual filter data in others.
- Slicers and Filters: Add slicers to your report to allow users to quickly filter data by specific criteria. You can also set page-level and report-level filters to control what data is displayed.
Example: Create a line chart to track monthly sales over a year. Format the chart to highlight sales peaks and troughs, and add a slicer to filter data by region, allowing users to compare sales performance across different areas.
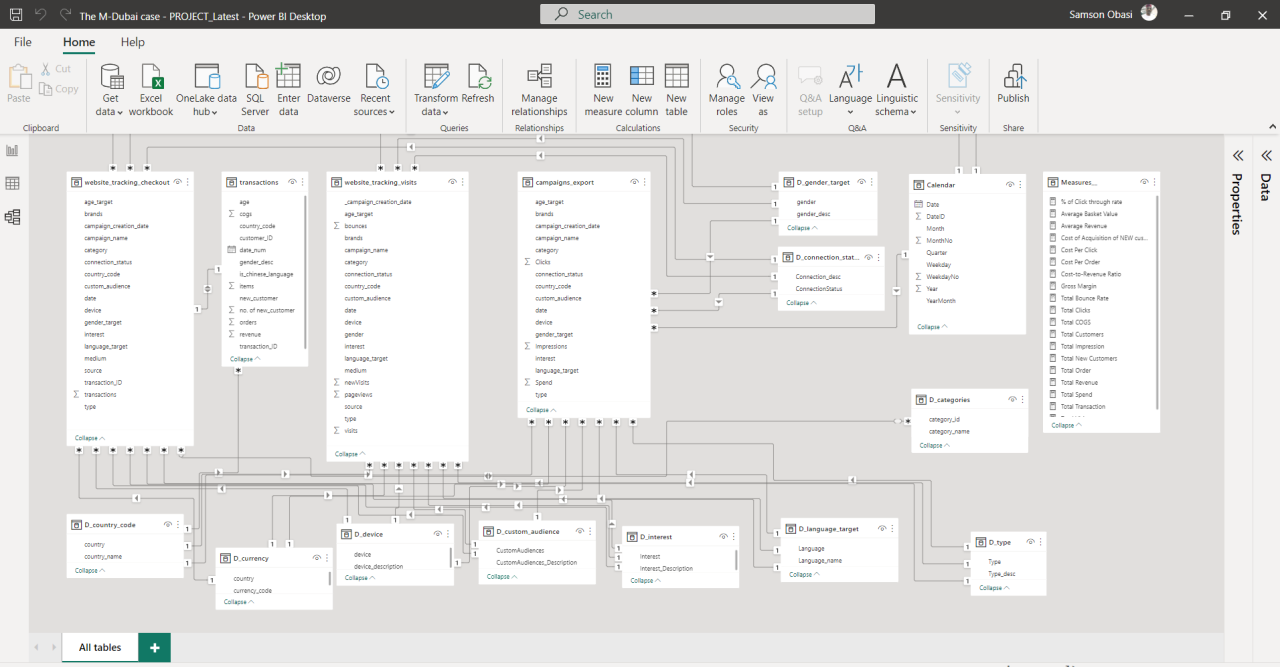
5. Data Modeling and Relationships
Understanding data modeling and relationships is key to unlocking Power BI’s full potential:
- Creating Relationships: Ensure your tables are linked by establishing relationships. Drag fields from one table and drop them onto fields in another to create a relationship. You can set the cardinality (one-to-one, one-to-many) and manage privacy settings.
- Star and Snowflake Schemas: Design your data model using a star or snowflake schema, where multiple tables are linked to a central fact table. This improves query performance and simplifies report creation.
- Calculated Columns and Measures: Enhance your model with calculated columns (derived values in tables) and measures (calculations for aggregations). These can be used in visuals to provide additional insights.
Example: You have a “Sales” table and a “Products” table. By creating a relationship between the “ProductID” field in both tables, you can analyze sales data by product, allowing you to identify top-selling items and track performance over time.
6. DAX Functions and Formulas
DAX (Data Analysis Expressions) is Power BI’s formula language. It’s similar to Excel formulas but designed for more complex data modeling:
- Basic DAX Functions: Start with simple functions like SUM, AVERAGE, and COUNT to perform calculations on your data. You can also use logical functions like IF and SWITCH to create conditional calculations.
- Time Intelligence: Power BI has powerful time intelligence functions. Use functions like SAMEPERIODLASTYEAR to compare data across periods or TOTALYTD to calculate year-to-date totals.
- CALCULATE Function: This is a versatile function that lets you create custom calculations, taking into account specific filters or conditions.
- Measures and Quick Measures: Create custom measures using DAX formulas to perform advanced calculations. Power BI also offers Quick Measures, which are pre-built formulas that you can customize for common calculations.

Example: You want to calculate the year-over-year growth rate for sales. You can use the DAX formula: “=[Sales This Year] / [Sales Last Year] – 1” to achieve this, and then use the measure in a visual to display the growth rate.
7. Sharing and Collaborating
Power BI facilitates easy sharing and collaboration:
- Publish to the Web: You can publish reports to the web and embed them in websites or blogs. This option is great for sharing with people outside your organization.
- Power BI Service: Upload your reports to the Power BI Service, where you can share them with specific colleagues or teams. You can also create apps to distribute reports and dashboards more widely.
- Comments and Annotations: Use the comment feature to add context to reports and start conversations with colleagues. Annotations are also useful for highlighting specific insights or areas of interest.
- Subscriptions: Keep stakeholders informed by setting up subscriptions to deliver reports via email on a regular basis.
8. Best Practices and Advanced Tips
As you become more comfortable with Power BI, keep these best practices and advanced tips in mind:
- Data Security: Always ensure data security and privacy, especially when working with sensitive information. Utilize Power BI’s role-level security and data protection features.
- Data Modeling Efficiency: Strive for a well-designed data model with minimal redundancy. This improves performance and simplifies report creation.
- Report Performance: Keep an eye on report performance, especially with large datasets. Use the Performance Analyzer to identify bottlenecks and optimize your visuals.
- Data Governance: Establish data governance practices to maintain data quality and consistency. This includes data cleansing, validation, and regular reviews.
- Custom Visuals: Explore the wide range of custom visuals available in the Power BI marketplace to enhance the look and functionality of your reports.
- AI Integration: Leverage Power BI’s AI capabilities, such as Quick Insights and Automated Machine Learning, to uncover hidden patterns and trends in your data.
- Power BI Premium: For enterprise-level features, consider Power BI Premium, which offers enhanced scalability, dedicated cloud computing capacity, and advanced collaboration tools.
Conclusion
Starting your Power BI journey can be exciting and rewarding. By following the tips and tricks outlined in this guide, you’ll be well on your way to becoming a Power BI master. Remember, practice makes perfect, so continue exploring, experimenting, and seeking out new challenges. As you continue to develop your Power BI skills, what specific areas or features are you most excited to dive into? Do you see any unique applications for Power BI in your field or industry?