Introduction
In today’s data-driven world, Microsoft Power BI has emerged as a powerful tool for businesses and analysts, offering robust capabilities for data analysis and visualization. However, as users delve into its advanced features, they often encounter challenges that can hinder their progress. This article aims to explore these challenges and provide practical solutions, empowering users to unlock Power BI’s full potential and derive impactful insights from their data.
A Journey into Power BI’s Advanced Features
Power BI provides a comprehensive suite of functionalities that extend beyond basic data exploration. Its advanced features include:
- Complex Data Integration: Power BI allows connections to various data sources, from Excel spreadsheets to large-scale databases. Integrating and transforming diverse data sets into a cohesive model can be challenging but rewarding for comprehensive insights.
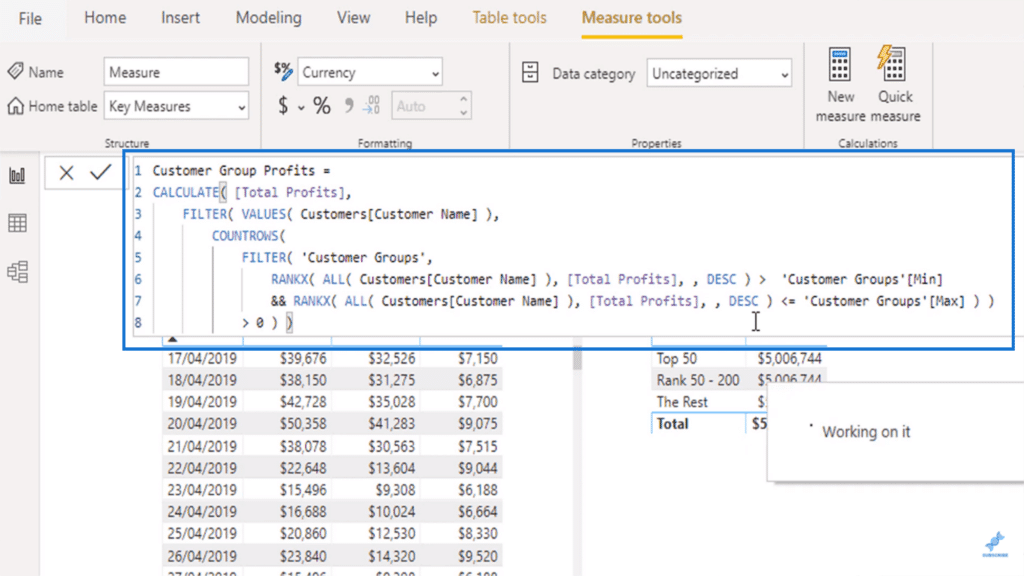
- DAX Functions: Data Analysis Expressions (DAX) is a powerful formula language in Power BI. While it offers advanced calculations and logic, mastering DAX can be intimidating for new users.
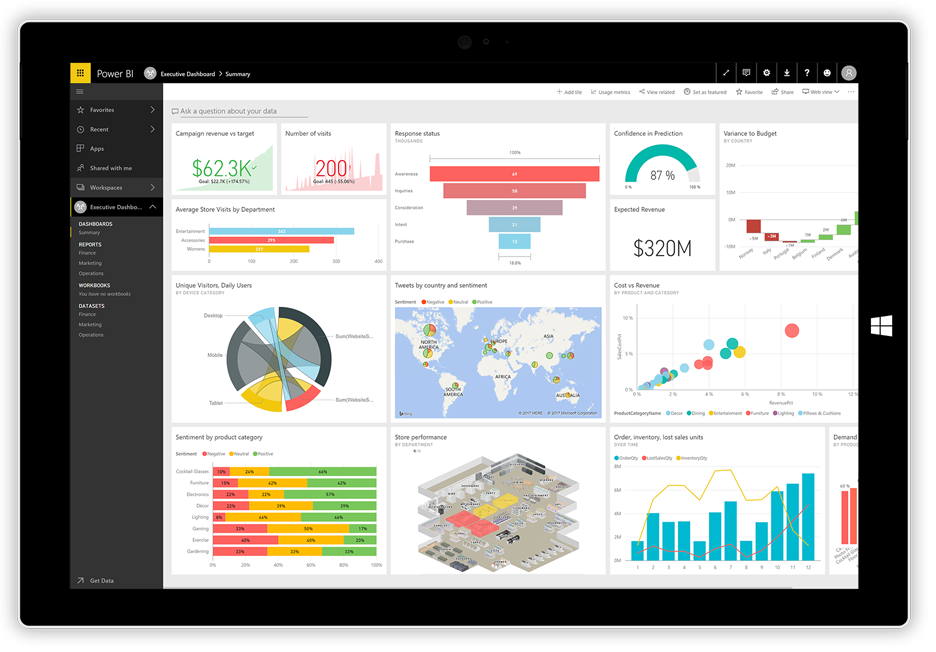
- Data Visualization Techniques: Power BI provides a wide range of visual tools, from simple charts to custom visuals. Creating effective and engaging dashboards that convey complex information clearly is an art.
- Report Performance Optimization: As reports become more complex, performance can suffer. Optimizing models, managing data size, and enhancing calculation efficiency are crucial for a seamless user experience.
- Security and Data Privacy: With sensitive business data, security is paramount. Ensuring data privacy and implementing role-based access controls can be complex but are essential steps.
Challenge 1: Complex Data Integration
Scenario: Imagine you work for a retail company with multiple sales channels, including online and physical stores. You want to analyze sales data from various sources, such as e-commerce platforms, POS systems, and customer relationship management (CRM) software. Integrating and transforming this data into a cohesive model is a challenge. Solution: Power BI’s Power Query tool is a game-changer for complex data integration. Here’s how you can tackle this challenge:
- Connect and Transform: Use Power Query to connect to your diverse data sources. It automatically detects data types and structures, allowing you to transform and clean the data efficiently.
- Data Modeling: Create a robust data model by defining relationships between tables. Power Query’s “Manage Relationships” feature simplifies this process, ensuring accurate calculations across tables.
- M Query Functions: Leverage M Query functions to perform advanced transformations. For example, you can use the “Merge Queries” function to combine data from multiple sources or the “Group By” function for aggregations.
- Data Mapping: If your data sources have different structures, use Power Query’s mapping features to map columns between sources, ensuring seamless integration.
- Data Quality Checks: Implement data quality checks and data validation steps to identify and rectify inconsistencies or missing values before loading the data into your model.
Example: A retail company integrated sales data from online and offline channels, cleaned and transformed it using Power Query, and created a data model with relationships. This enabled them to analyze sales trends and customer behavior holistically, leading to better inventory management and targeted marketing campaigns.
Challenge 2: Advanced DAX Functions
Scenario: You want to calculate the year-over-year growth rate for your sales data, but you’re unfamiliar with more complex DAX functions. Solution: DAX functions can be powerful tools for advanced calculations. Here’s a strategy to overcome this challenge:
- Start with Basics: Begin by understanding fundamental DAX functions like CALCULATE, SUM, and FILTER. These form the building blocks for more complex formulas.
- Online Resources: Leverage the wealth of online resources, including Microsoft’s official documentation, tutorials, and YouTube videos, to learn and practice advanced DAX functions.
- Step-by-Step Debugging: When crafting complex formulas, use the formula bar to debug step by step, identifying and rectifying errors as you go.
- DAX Studio: Utilize DAX Studio, a free tool, to analyze and optimize your DAX queries. It provides insights into query performance and suggestions for improvements.
- Community Support: Engage with the Power BI community forums and user groups to seek guidance and share solutions.
Example: A sales analyst wanted to calculate the year-over-year growth rate for sales. Using the CALCULATE function, combined with DATEADD and SAMEPERIODLASTYEAR, they crafted a formula to compare sales within specific date ranges. This provided valuable insights into long-term sales trends.
Challenge 3: Effective Data Visualization
Scenario: You’ve created a comprehensive report with various metrics and KPIs, but it looks cluttered and confusing, failing to convey key messages effectively. Solution: Effective data visualization is an art. Simplify and enhance your dashboards with these tips:
- Less is More: Stick to a few well-chosen visuals that convey your message clearly. Avoid the temptation to overload dashboards with excessive charts and graphs.
- Visual Hierarchy: Establish a visual hierarchy by using size, color, and placement to draw attention to the most important insights.
- Custom Visuals: Power BI offers a library of custom visuals. Use them sparingly and only when they add value to your story. Ensure they align with your brand and theme.
- Consistent Themes: Apply consistent color themes and font styles across your report to create a unified and professional look.
- Tooltips and Annotations: Utilize tooltips to provide additional context and annotations to highlight key trends or outliers.
- Drill-Down Options: Consider adding drill-down capabilities to explore data in more detail without cluttering the main dashboard.
Example: A marketing team created a dashboard to analyze campaign performance. They used a combination of clear charts, consistent color themes, and concise annotations to highlight key metrics like conversion rates and ROI. This enabled stakeholders to quickly grasp campaign effectiveness and make data-driven decisions.
Challenge 4: Slow Report Performance
Scenario: Your report, loaded with complex calculations and large data sets, takes ages to load, causing frustration among users. Solution: Optimizing report performance is crucial for a seamless user experience. Here’s how you can tackle this challenge:
- Optimize Data Model: Ensure your data model is well-designed, with appropriate relationships and no redundant data. This forms the foundation for efficient calculations.
- Summarization: Use data summarization techniques, such as aggregation and grouping, to reduce the volume of data being processed.
- Calculations Efficiency: Review and optimize your DAX formulas for efficiency. Avoid complex calculations within visuals and leverage Quick Measures for common calculations.
- Data Volume Management: Limit the amount of data loaded into your report. Use filters and date ranges to focus on relevant data.
- Power BI Premium: If your organization uses Power BI Premium, leverage its enhanced performance features, such as data caching and dedicated capacity.
Example: A financial analyst optimized a slow-performing report by summarizing data at the month-end level instead of daily transactions. They also leveraged aggregations and improved calculation efficiency, reducing report load time from minutes to seconds.

Challenge 5: Security and Data Privacy
Scenario: Your organization handles sensitive customer data, and you need to ensure compliance with data privacy regulations while allowing authorized users access to insights. Solution: Security and data privacy are critical. Implement these measures to safeguard your data:
- Row-Level Security (RLS): Use RLS to restrict data access at the row level. This ensures that users only see data relevant to their role or department.
- Data Encryption: Enable data encryption at rest and in transit to protect sensitive information from unauthorized access.
- Data Classification: Classify your data based on sensitivity levels and apply appropriate access controls.
- Regular Security Reviews: Conduct periodic security audits and reviews to identify and address any vulnerabilities.
- User Training and Awareness: Educate users about security best practices, including password policies and phishing awareness.
Example: A healthcare provider implemented RLS to ensure that doctors and nurses only accessed patient data for their assigned departments. They also used data encryption and regular security audits to maintain compliance with data privacy regulations.
Conclusion
Advanced Power BI features offer immense potential for in-depth data analysis and insights. While challenges may arise, they can be overcome with the right strategies and a growth mindset. By tackling complex data integration, mastering DAX functions, creating effective visualizations, optimizing performance, and ensuring data security, organizations can leverage Power BI to drive data-informed decisions and achieve their goals. Remember, every challenge presents an opportunity for growth and improvement. As you continue your Power BI journey, stay curious, keep learning, and never shy away from tackling complex features. Share your experiences and insights in the comments, and let’s continue the conversation on unlocking Power BI’s full potential! What has been your biggest challenge in using Power BI’s advanced features, and how did you overcome it? Feel free to share your thoughts and experiences!